Reproducible methods for network simplification
Robin Lovelace 
Leeds Institute for Transport Studies, University of Leeds, UK
Zhao Wang
Leeds Institute for Transport Studies, University of Leeds, UK
Will Deakin
Digital, Data and Technology services, Network Rail, UK
Josiah Parry
Environmental Systems Research Institute, Redlands, CA, USA
Details
- For listen-along audio, download and open this: https://github.com/nptscot/networkmerge/releases/download/v1/networkmerge-talk-gisruk.mp4
- For the associated GISRUK extended abstract, see here: https://github.com/nptscot/networkmerge/releases/download/v1/gisruk.pdf
- For the code, see here: https://github.com/nptscot/
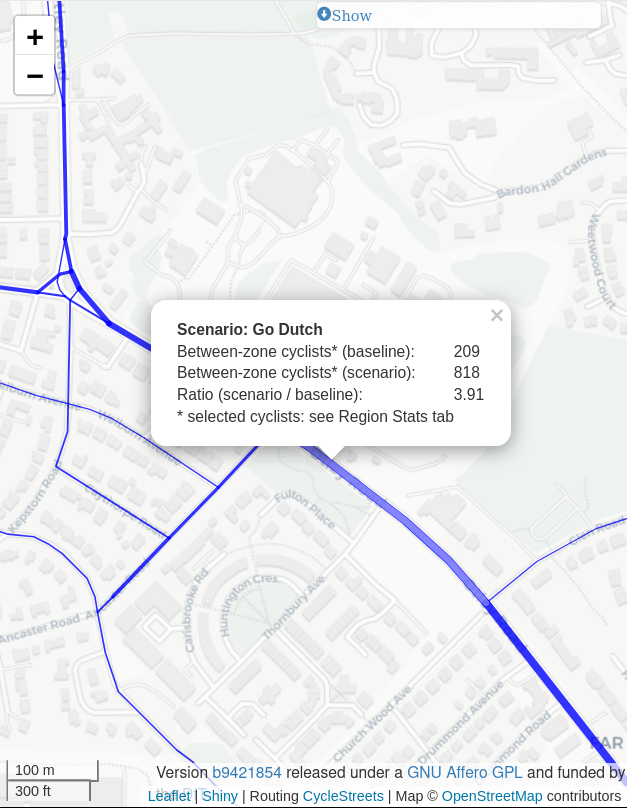
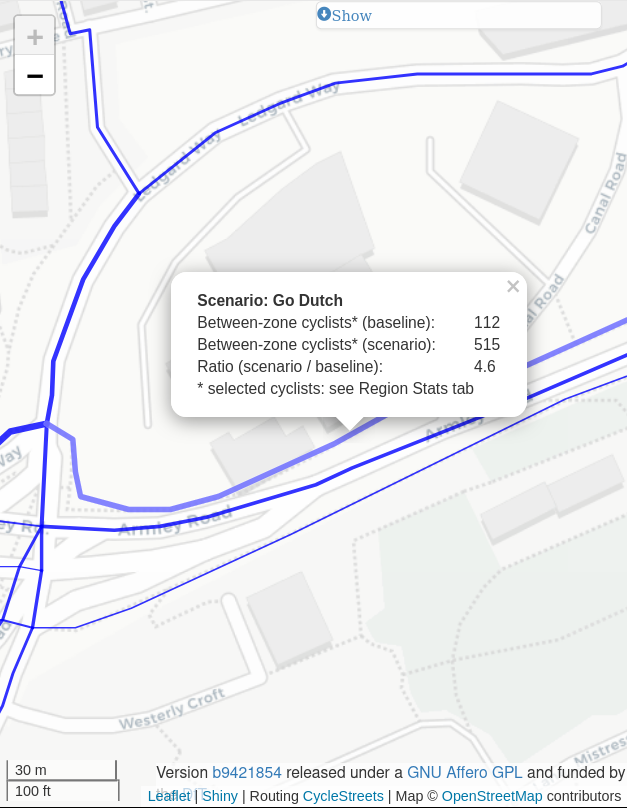
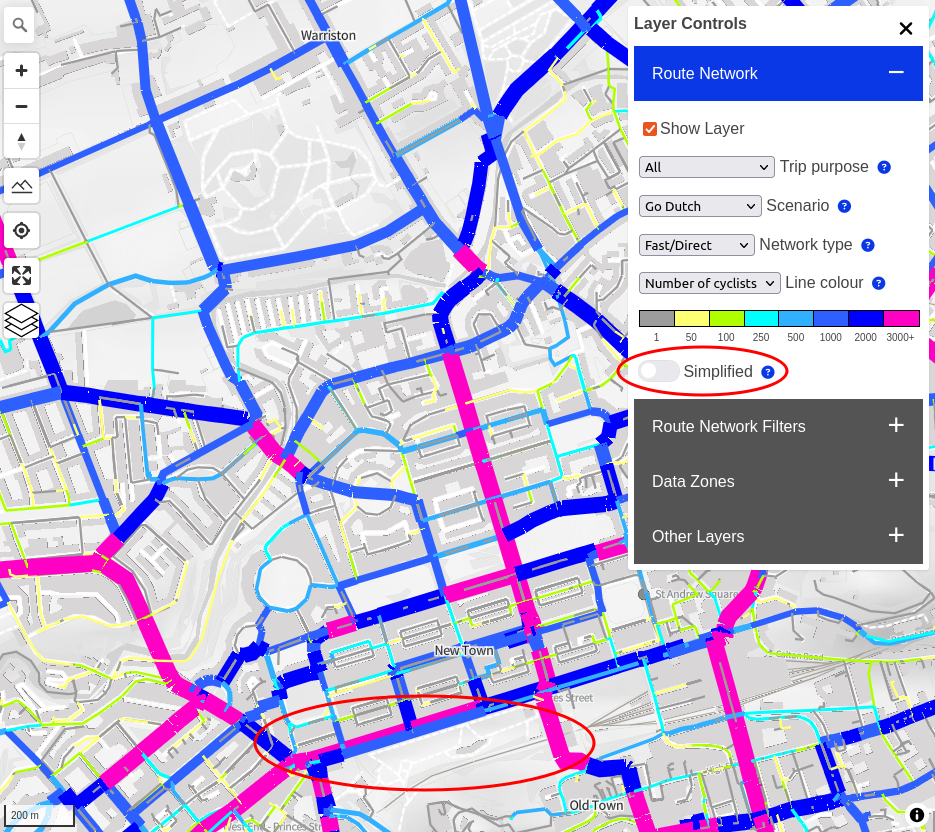
The problem
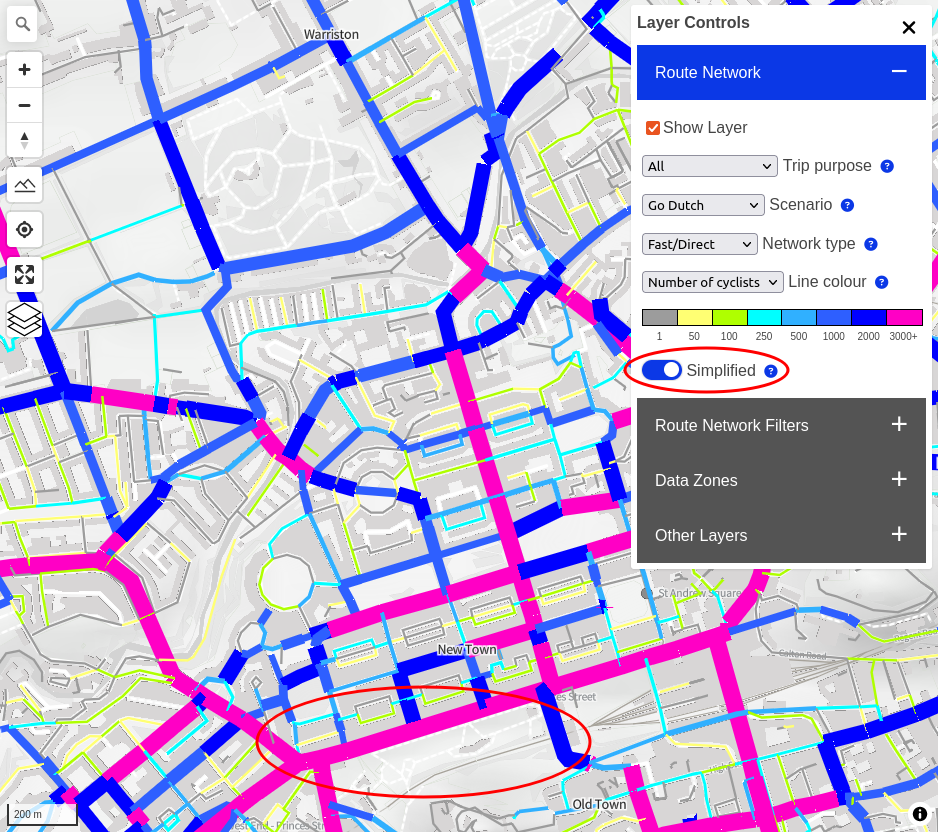
Solution + demo
Prior work
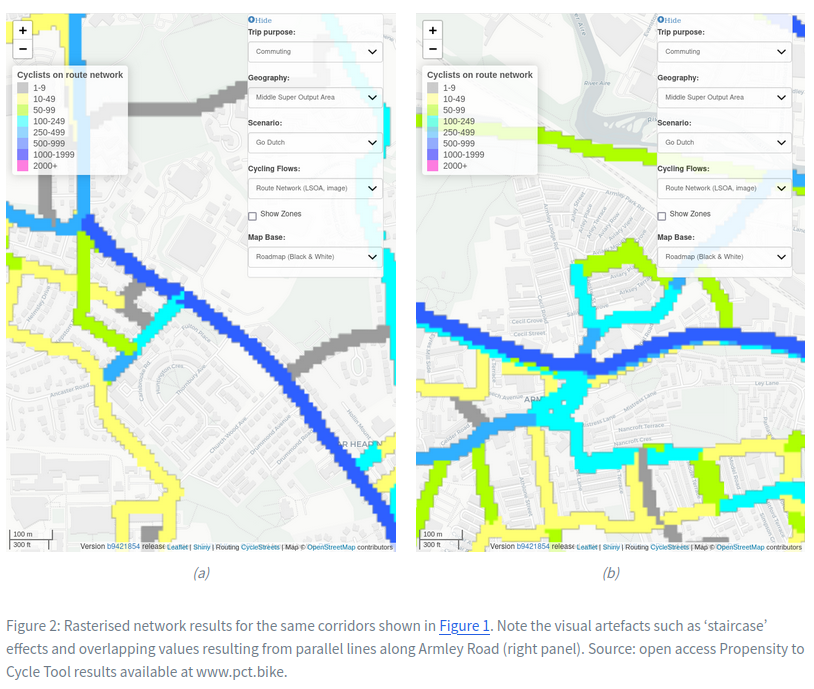
Route network aggregation generates estimates of flow on the network, rasterisation help with visualisatioin (Morgan and Lovelace 2020)
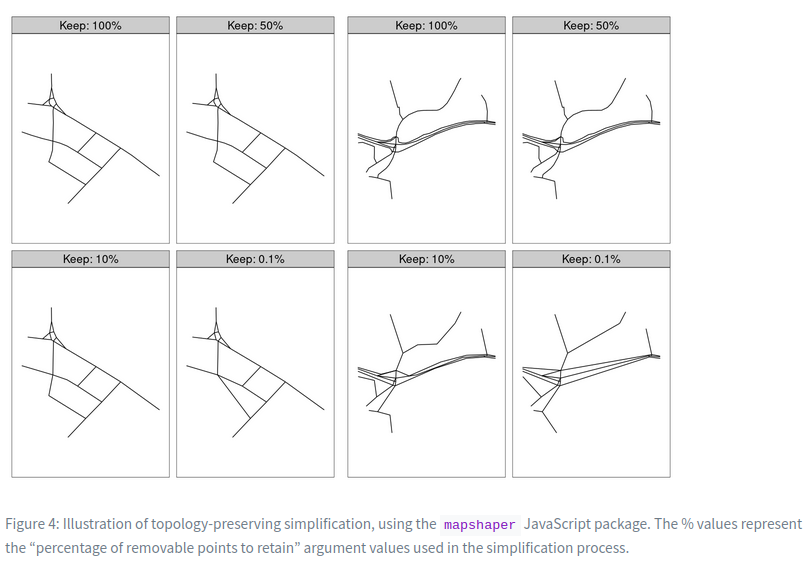
Existing simplification algorithms
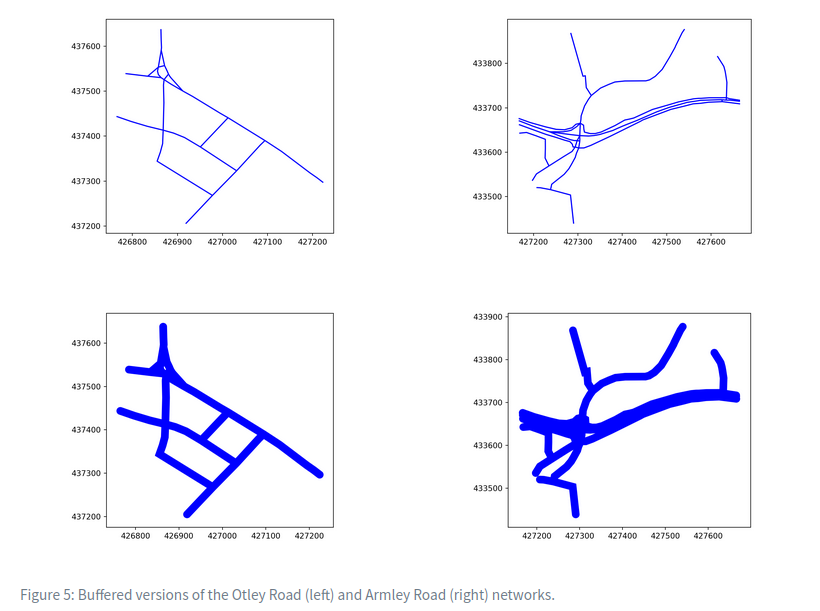
Buffering
Buffer rasterisation
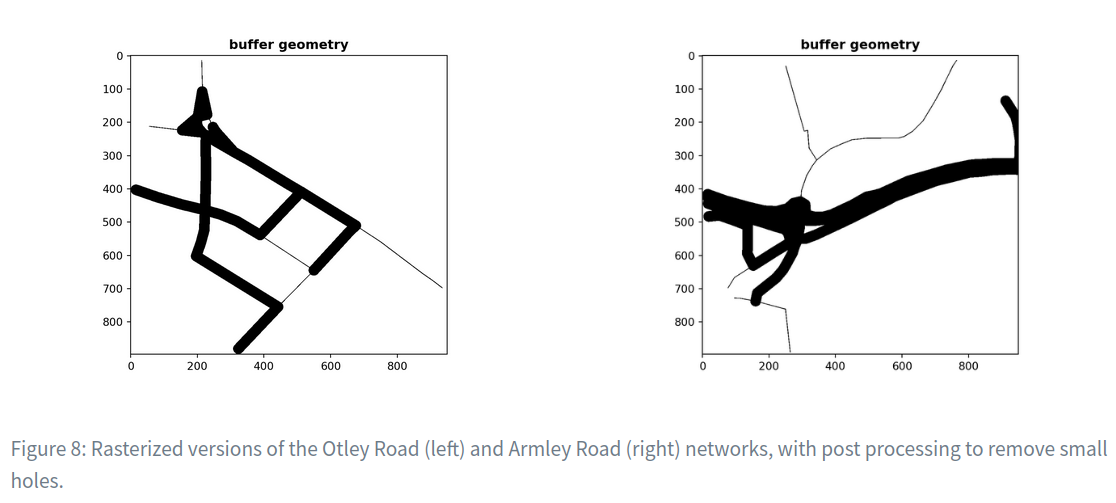
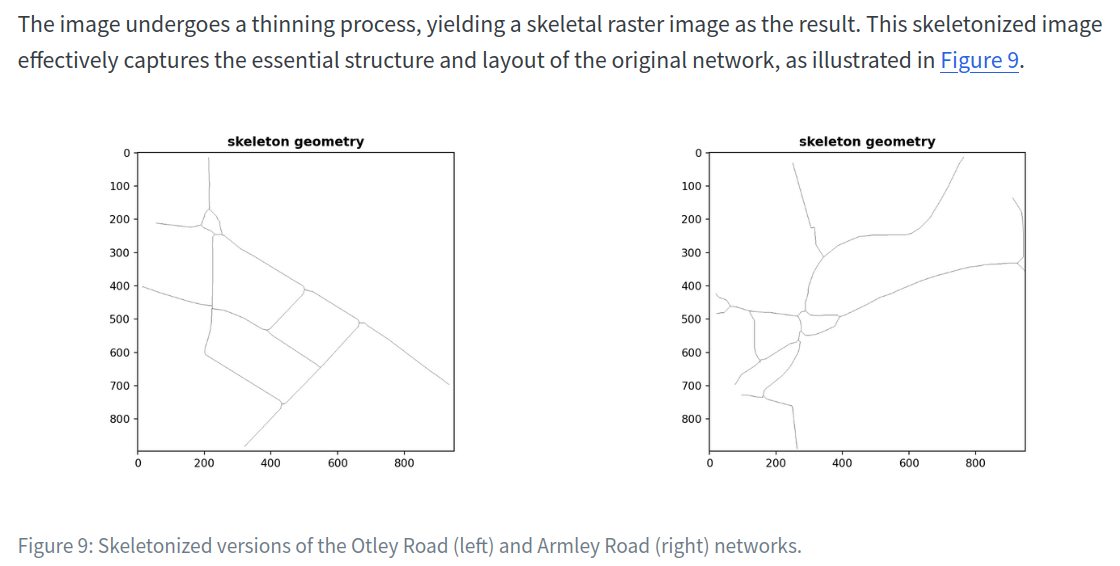
skeletonization
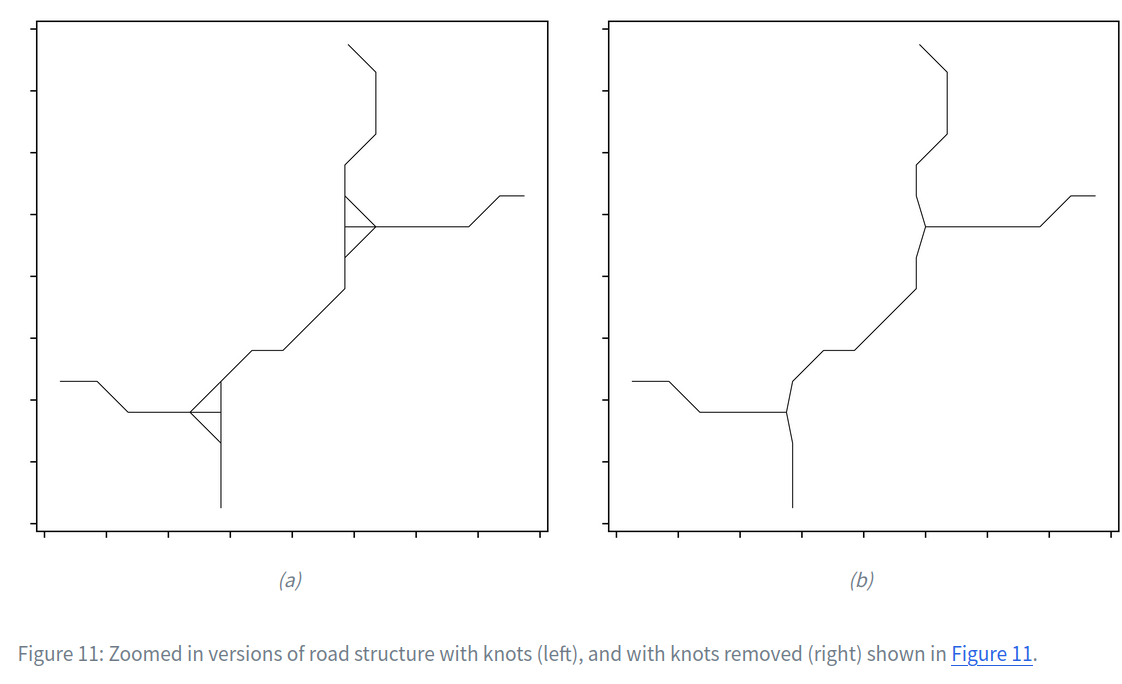
Knot removal
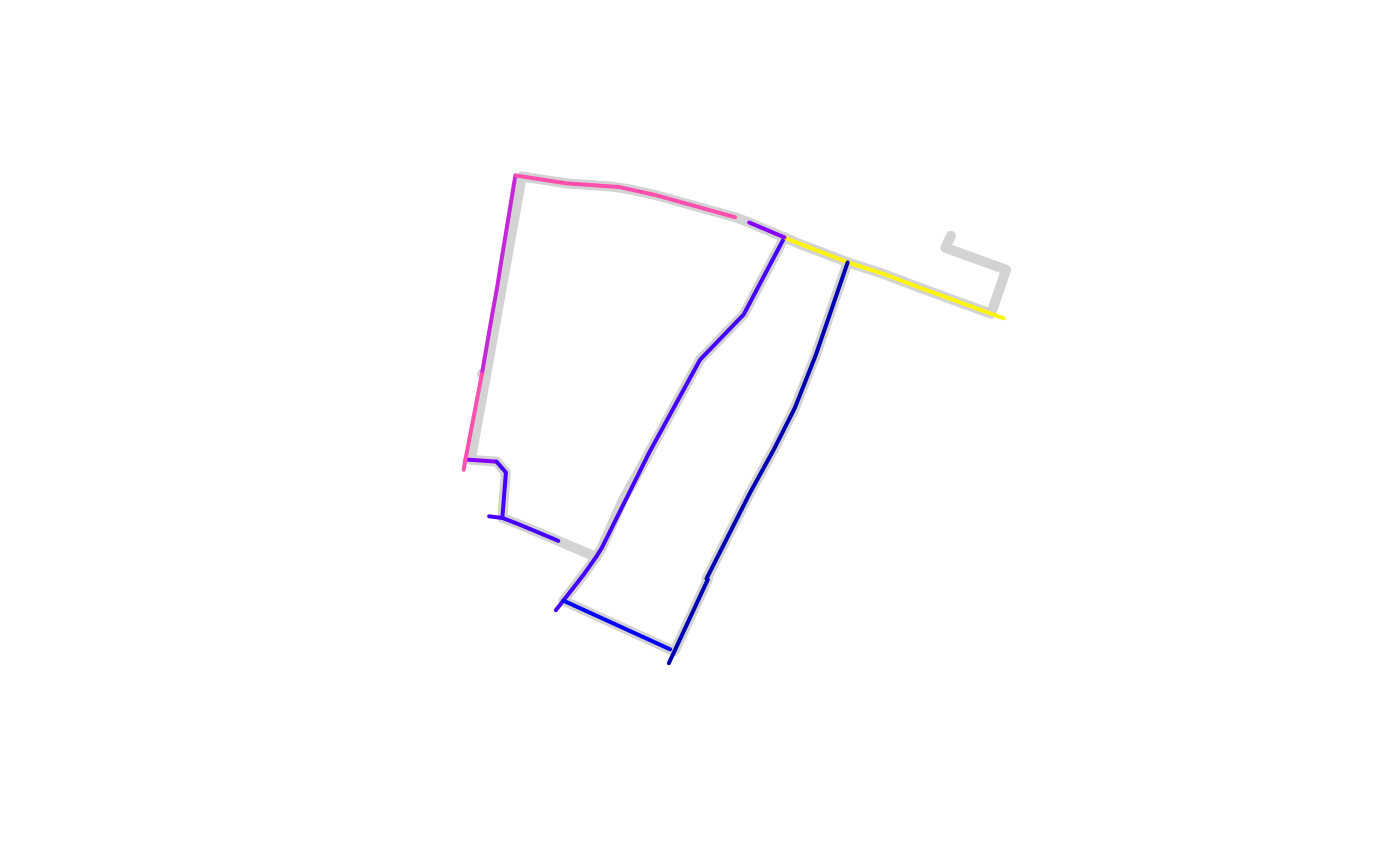
The merge stage
The code
The code underlying the results presented in this paper are available from the following repositories:
- The
nptscot/networkmergerepository contains the reproducible paper. - The
parenxPython for image skeletonization and Voronoi diagram-centreline identification is available on PyPI in the GitHub repoanisotropi4/parenx. - The
rnetmatchR package for network simplification is available on GitHub in the reponptscot/rnetmatch.