
Networkmerge methods
Both input datasets were sourced from the Propensity to Cycle Tool (PCT) which in turn is based on OpenStreetMap (OSM) (see the ‘parenx cookbook’, a technical appendix that accompanies this paper, for an example of the method applied to a rail network dataset).
The Ottley Road example, which comprises 21 segments, represents an important single carriageway road in Leeds. The main road is represented by a single centreline and with a simplified representation of a roundabout in the northwest (top left) and side roads. The Armley Road example, which comprises 27 segments, by contrast, represents a more complex corridor that is represented by multiple parallel ‘braided’ linestrings on OpenStreetMap. In addition to linestrings representing the road, the corridor contains parallel linestrings representing cycleways.
There are two main challenges that need to be overcome to simplify transport networks, in a way that preserves their value:
- Simplifying the geometry
- Assigning attributes to the simplified network
Sections Section 1 to Section 3 describe methods for simplifying the geometry of the network. The key contributions of the paper are the novel methods of image skeletonization, presented in Section 2, and simplification with Voronoi diagrams to identify central lines, covered in Section 3. To make use of simplified networks in transport planning, it is also necessary to assign attributes to the simplified network. This is covered in Section 5.
1 Topology-preserving simplification
Topology-preserving simplification reduces the number of vertices in a linestring while preserving (or at least attempting to preserve) the topology of the network, i.e. not merging parallel lines. As shown in top panel of Figure 2, topology-preserving simplification can reduce the number of edges, but fails to merge parallel lines in complex geometries, as shown in the the bottom panel in Figure 2.

mapshaper JavaScript package. The % values represent the “percentage of removable points to retain” argument values used in the simplification process.
2 Simplification via skeletonization
The skeletonization approach generates a simplified network by buffering the network, applying an image skeletonization algorithm, and extracting lines segments from a raster of this buffer.
In both the skeletonization and Voronoi approaches, the network simplification process starts by applying a buffer to linear geometry in a projected, rather than coordinate system. We use a buffer size of 8 meters in this paper, which roughly corresponds to the width of a typical road, with the result illustrated in Figure 3.


2.1 Network skeletonization
In skeletonization, overlapping lines are identified, buffered, transformed into a raster image, the image processed through a thinning algorithm, and a skeletal representation of the original network produced. This skeletal structure preserves the overall extent and connectivity of the network, with a central line that follows the centre-line of the combined buffered area.
Skeletonization is only applied to segments where more than one of their respective buffers overlap. To identify overlapping line-segments, the buffer is split at the end of each line-segment, see top Otley Road (left) and Armley Road (right) Figure 4. The overlapping line-segments are then buffered while retaining the remaining disjoint lines, shown in bottom Figure 4.
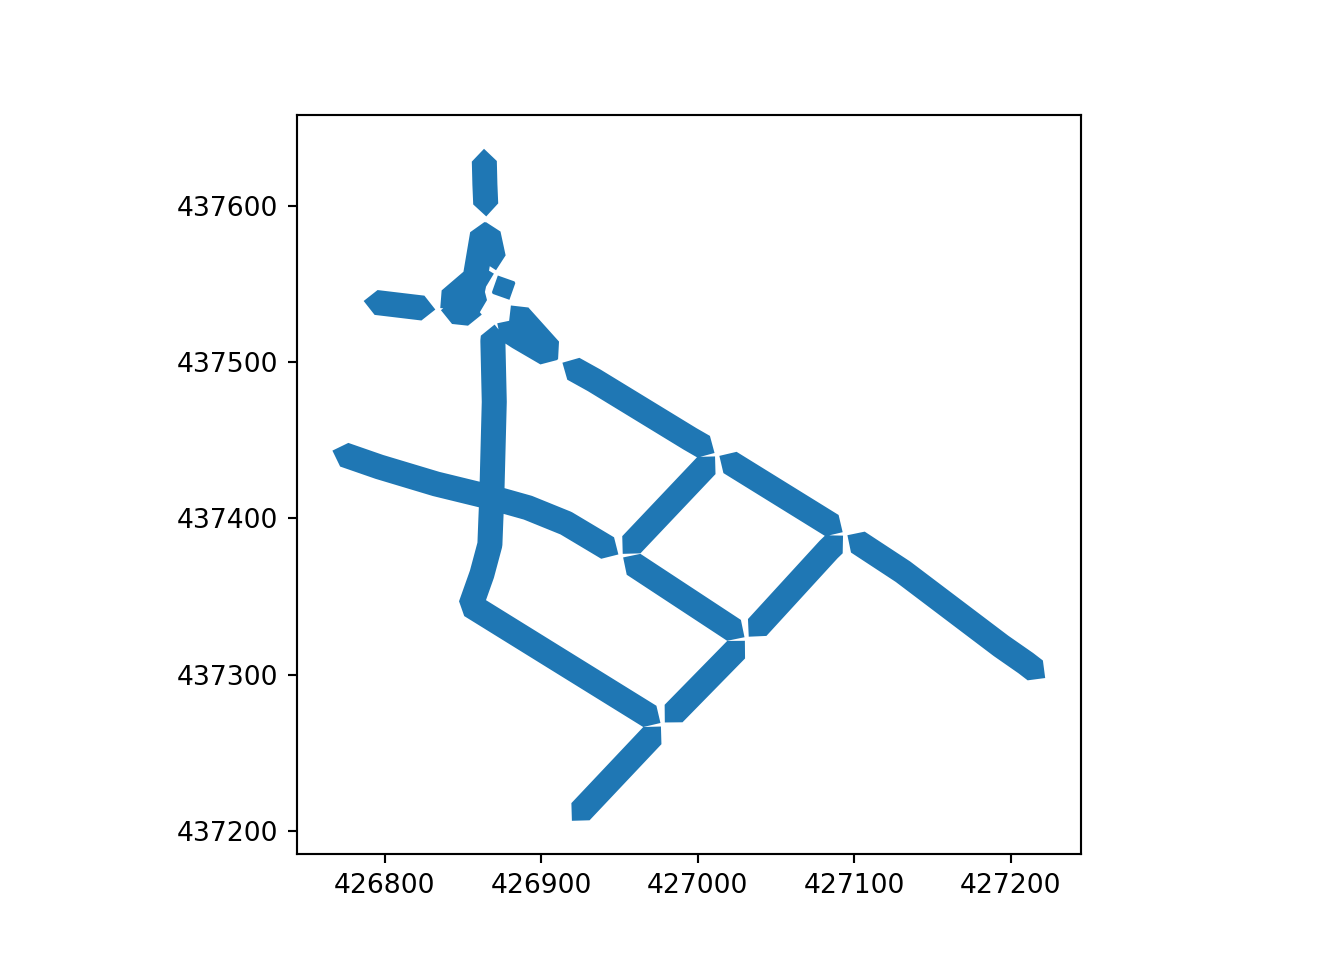
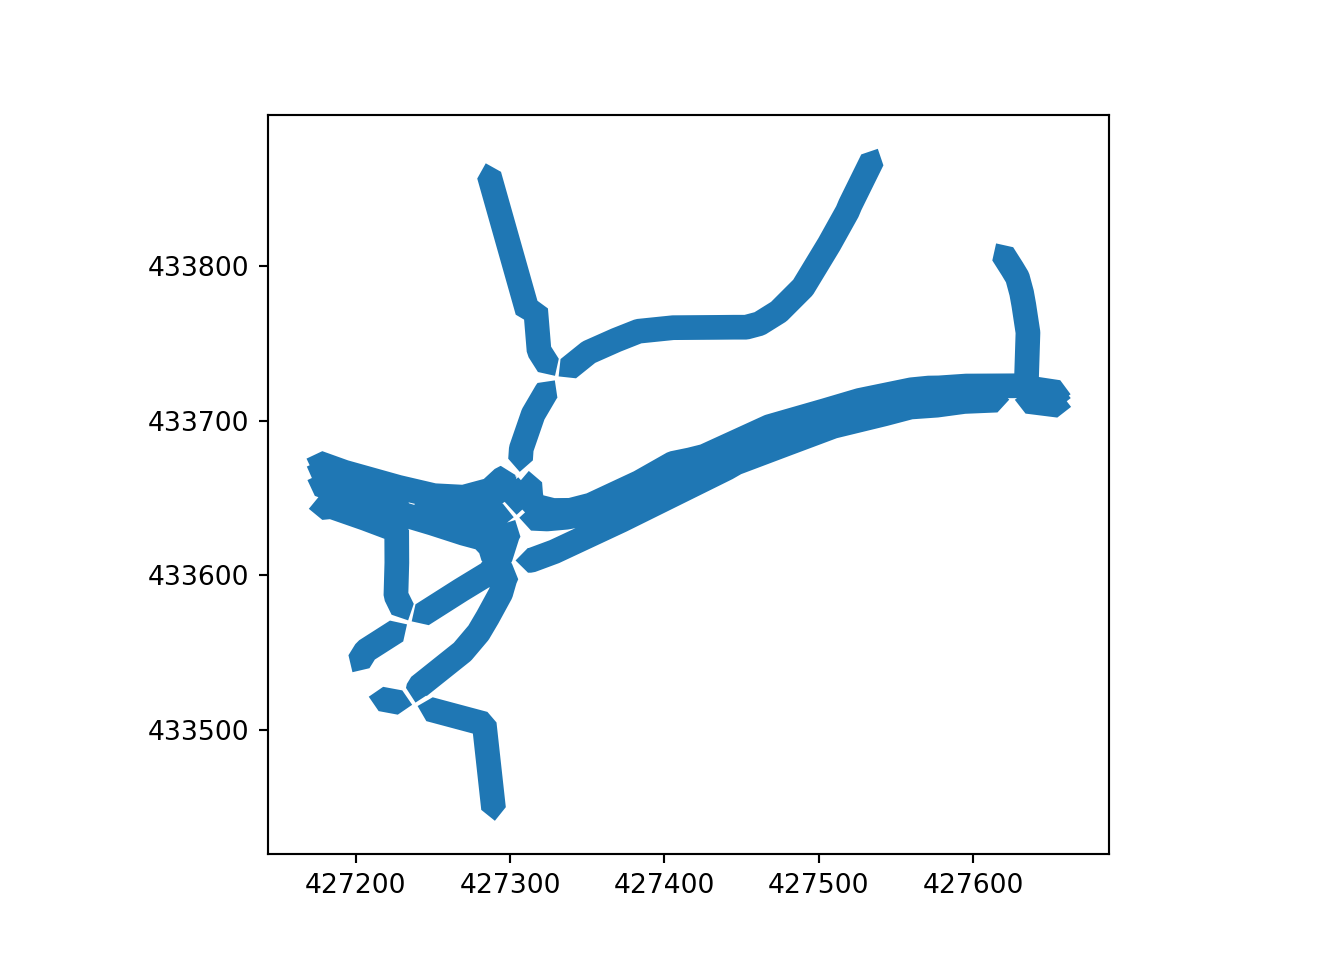
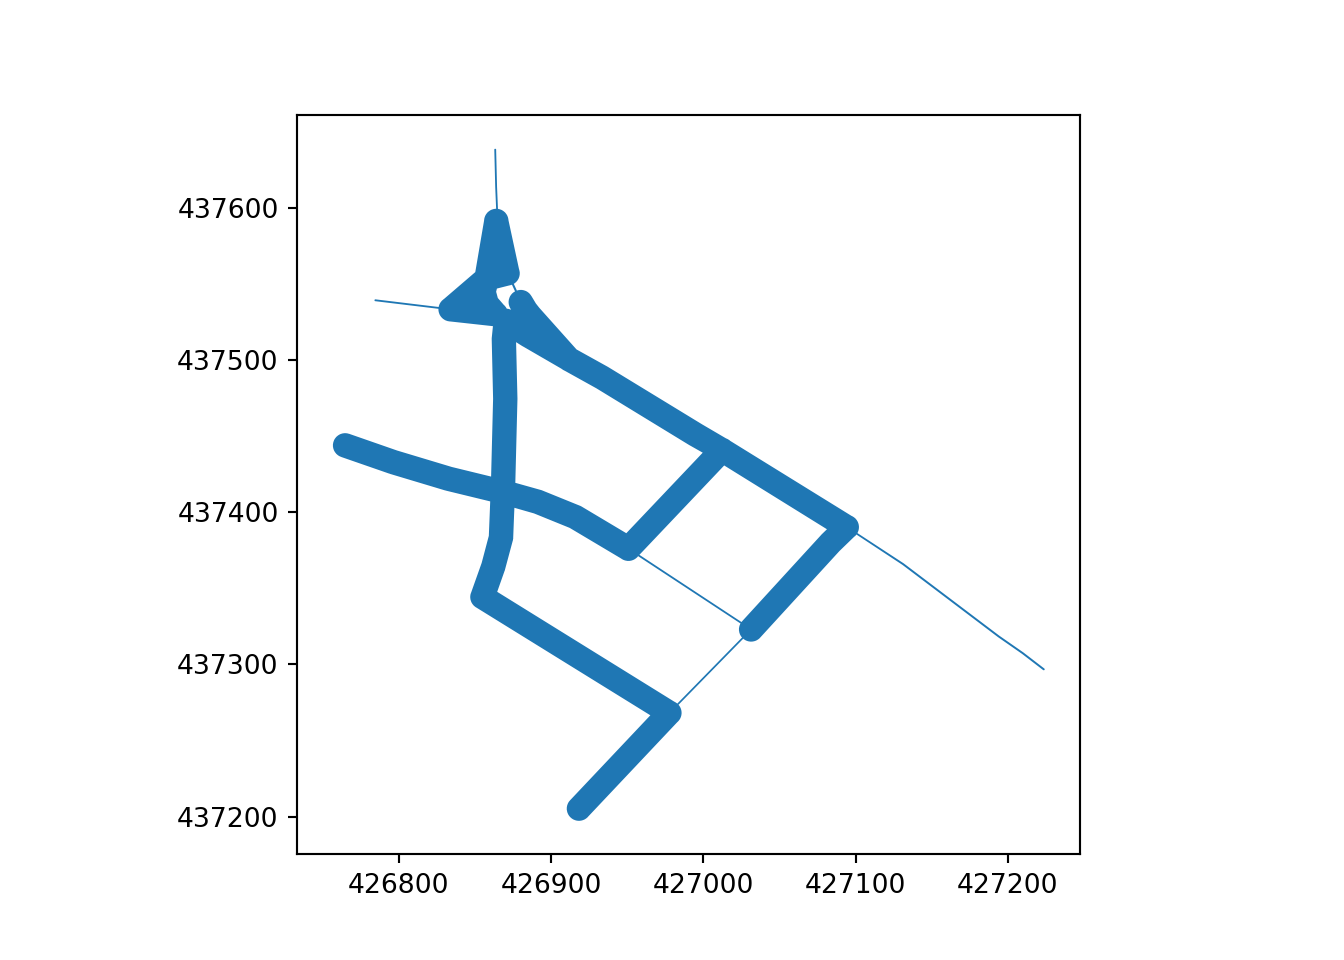
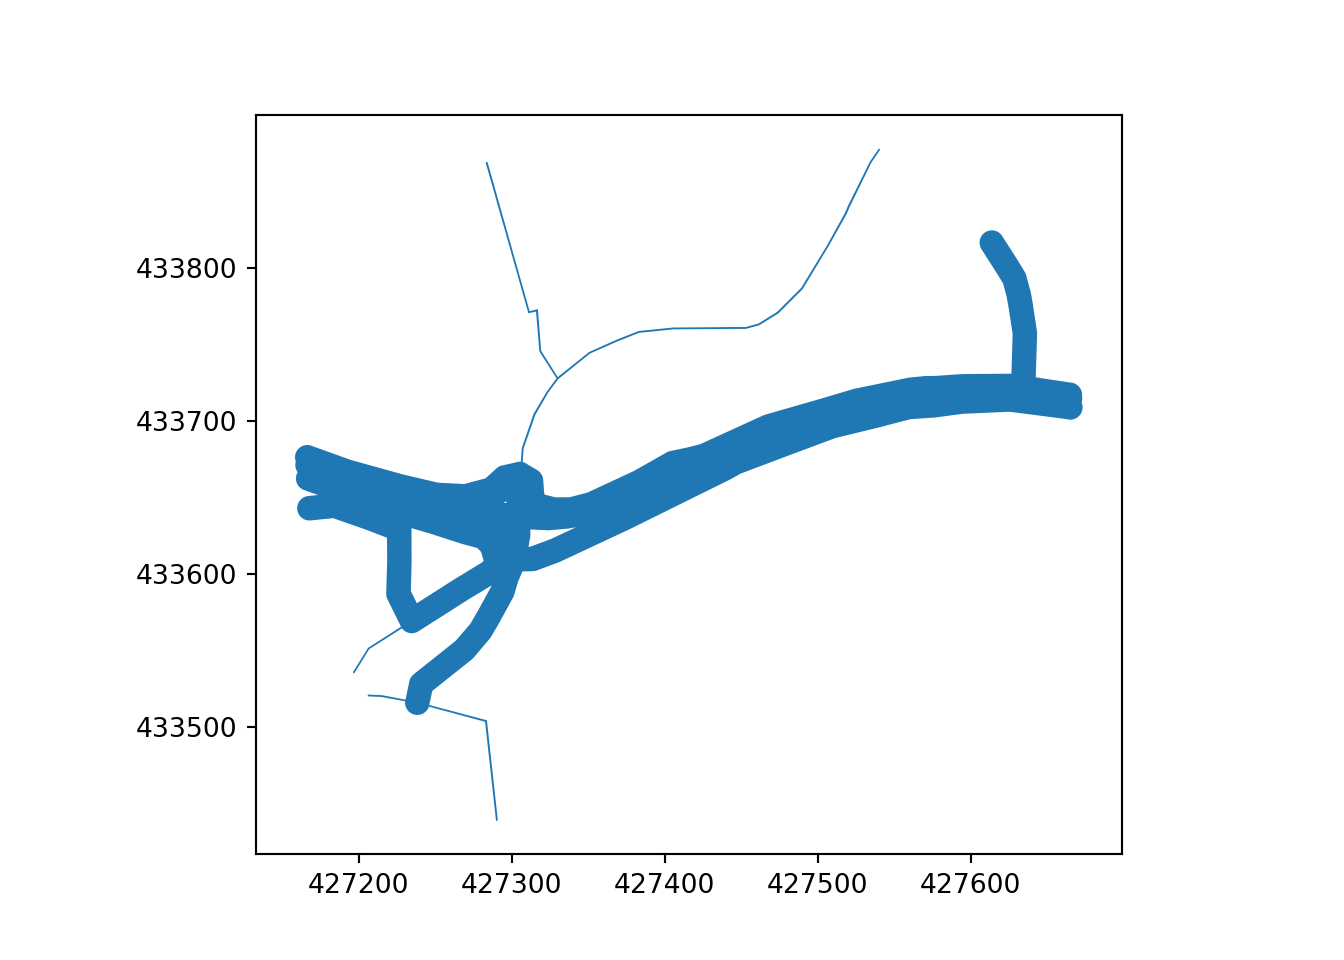
As detail is lost in transforming of the geometry to an image buffer or raster, more detail can be retained by using an affine transformation to increase the number of points in the buffer prior to skeletonization and reducing scale when creating the simplified linear geometric representation.
The raster image also requires pre-processing to eliminate small holes that appear where buffered lines run parallel or intersect at shallow angles. The result of the scale and cleaned raster is illustrated in Figure 5.
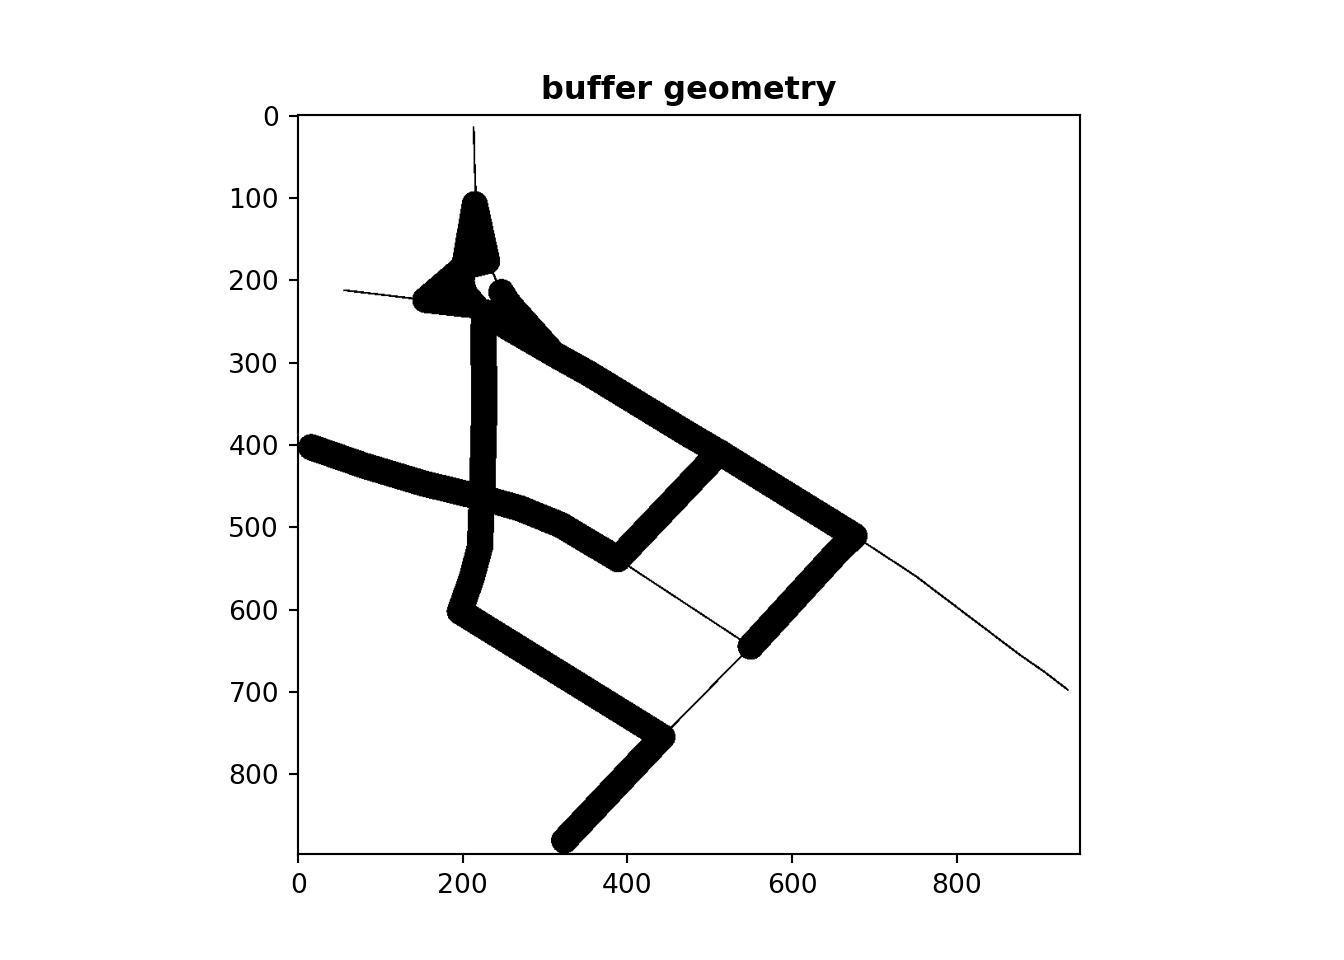
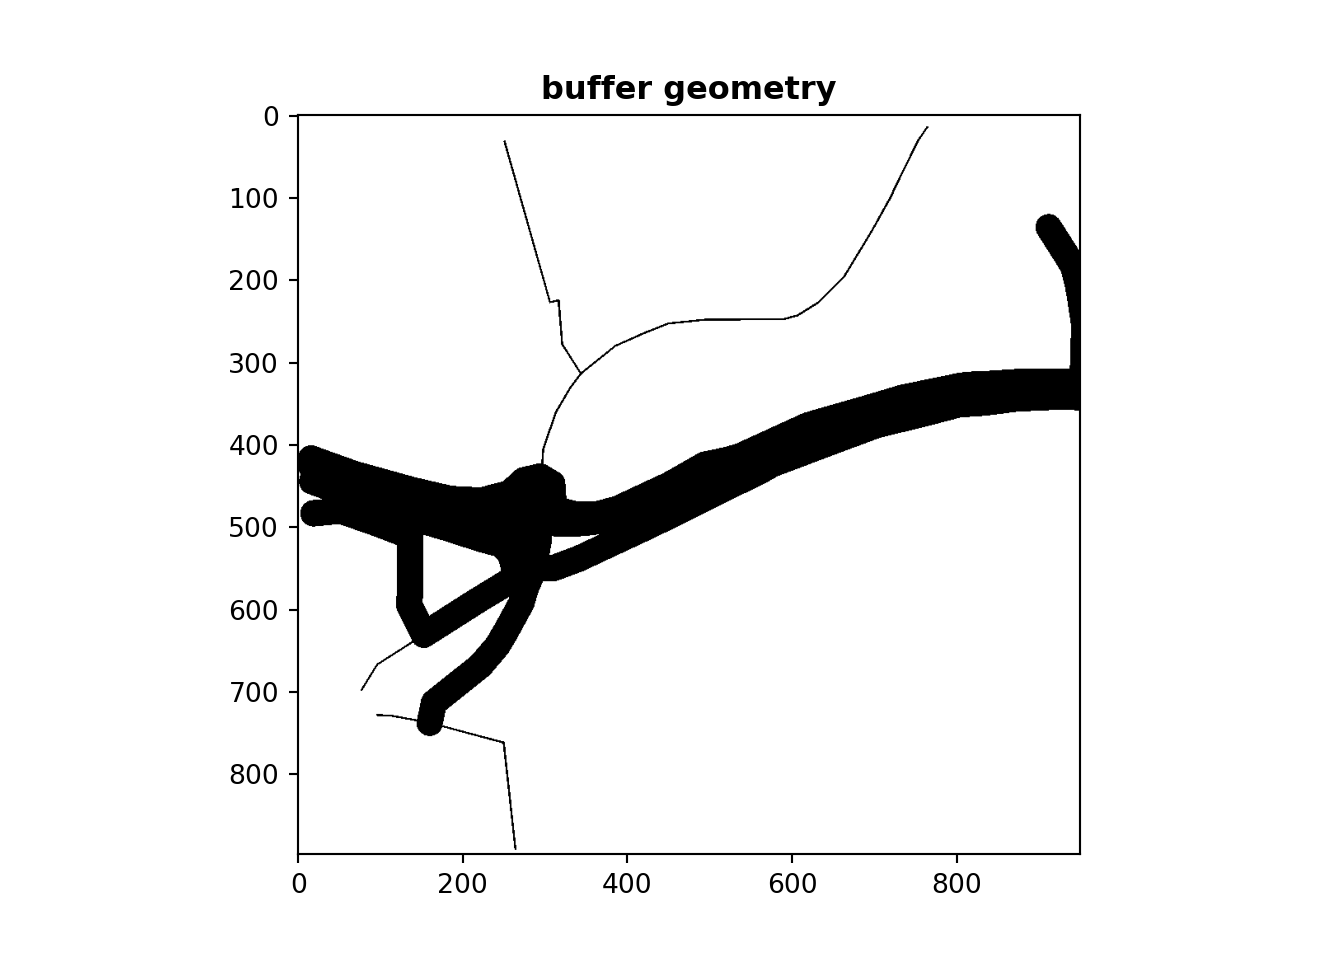
The skeletonization algorithm is then applied to the raster image yielding a skeletal raster image, as shown in Figure 6.
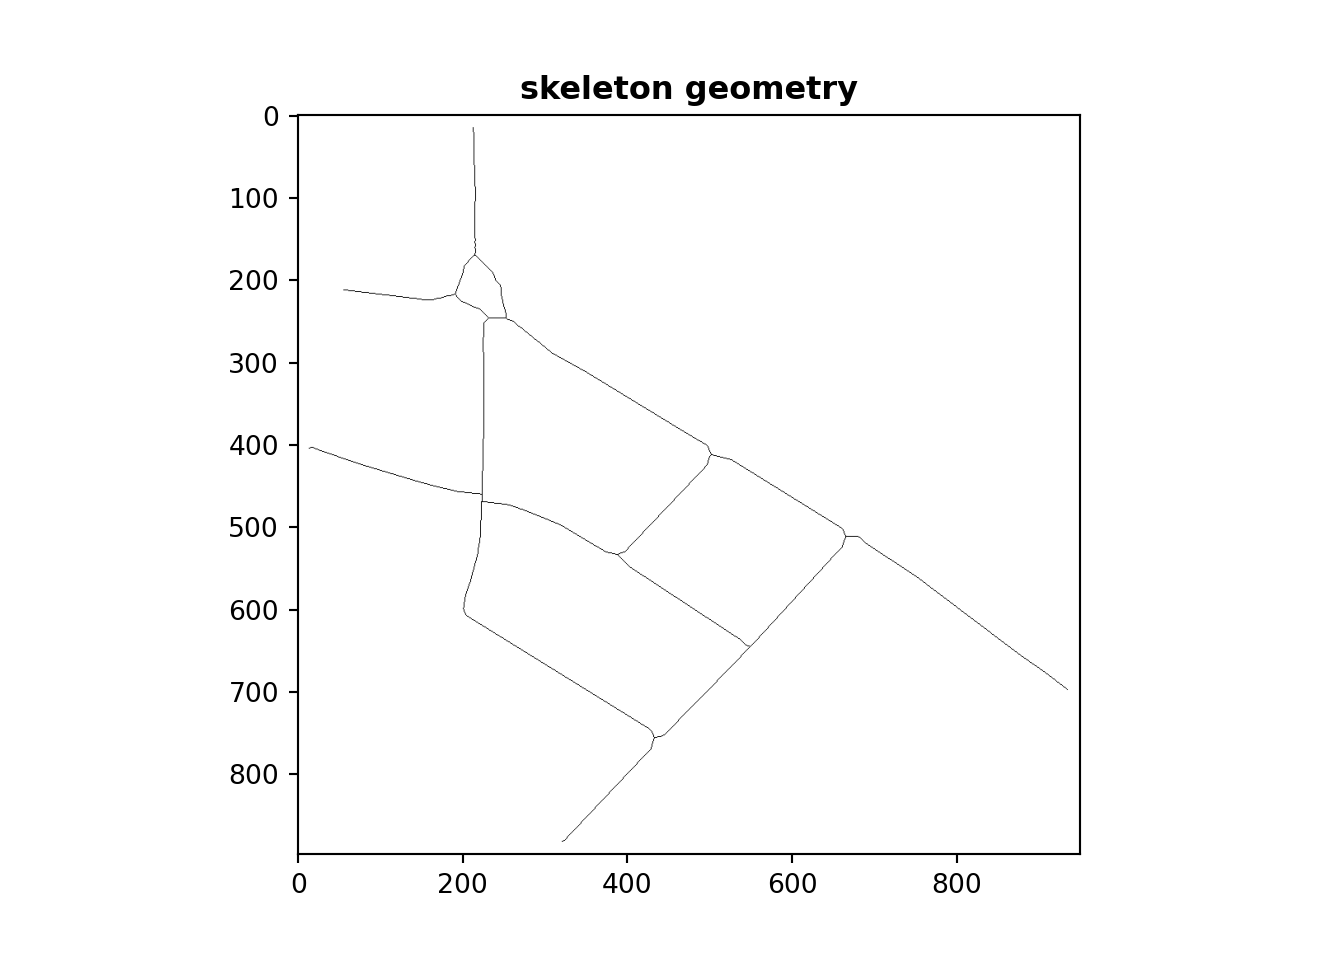
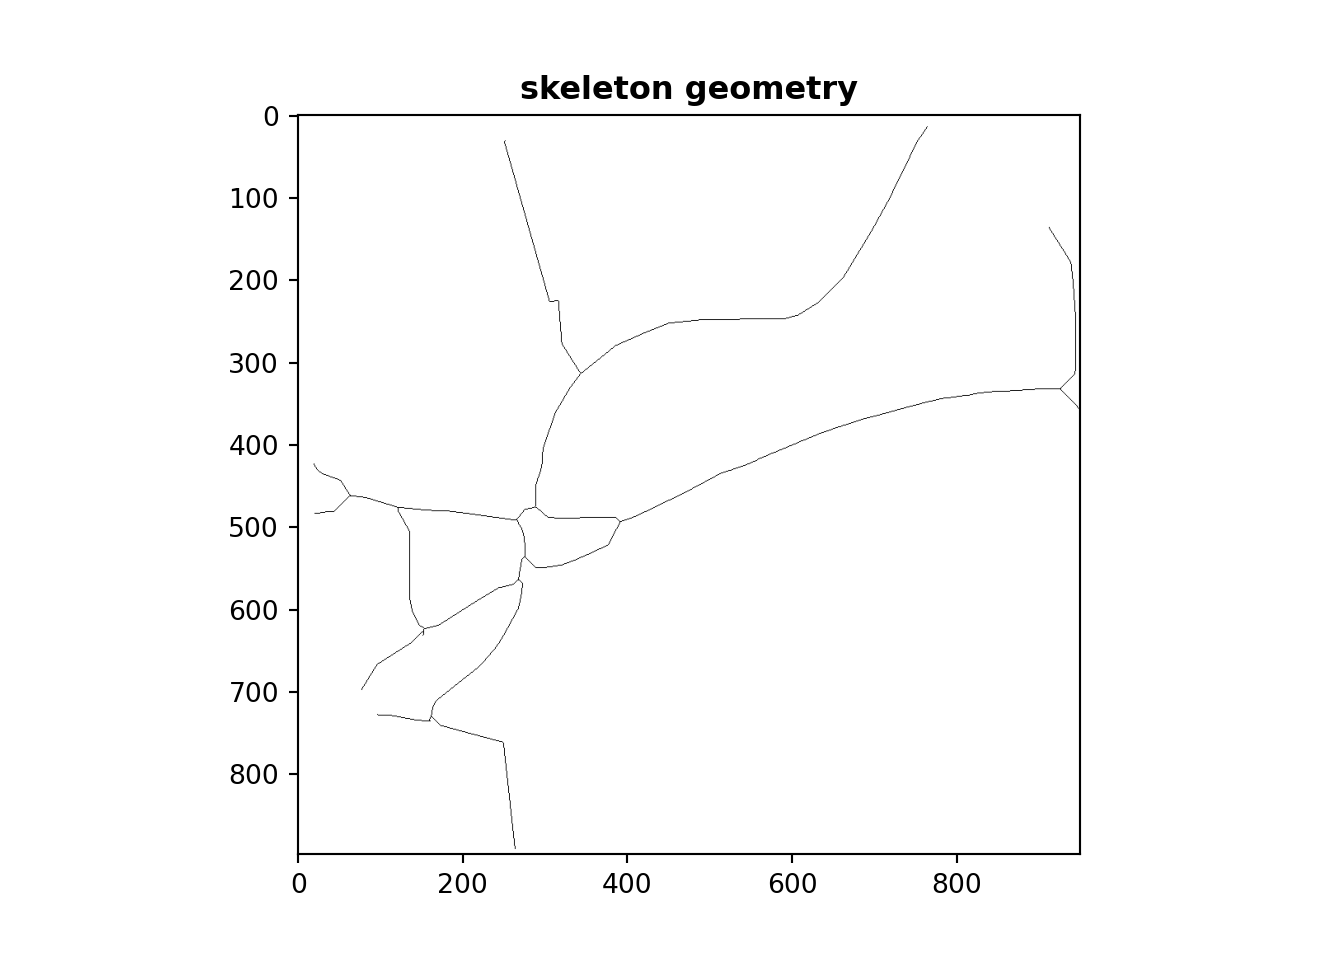
2.2 Recreating a linear geometry
The rasterized skeletal image is then converted back into a linear vector geometry, completing the vector-to-raster-to-vector geometry transformation:
Adjacent points are identifed, typically within a 1x1 pixel square, based on proximity within the raster image coordinate system. Line segments are then created by connecting these adjacent points. These points are combined, giving a continuous line geometry representing the simplified network. Finally, a reverse scaling affine transformation is applied to return to the original coordinate system.
Noting that creating a line geometry from the set of points in the raster buffer is arguably the most complex step.
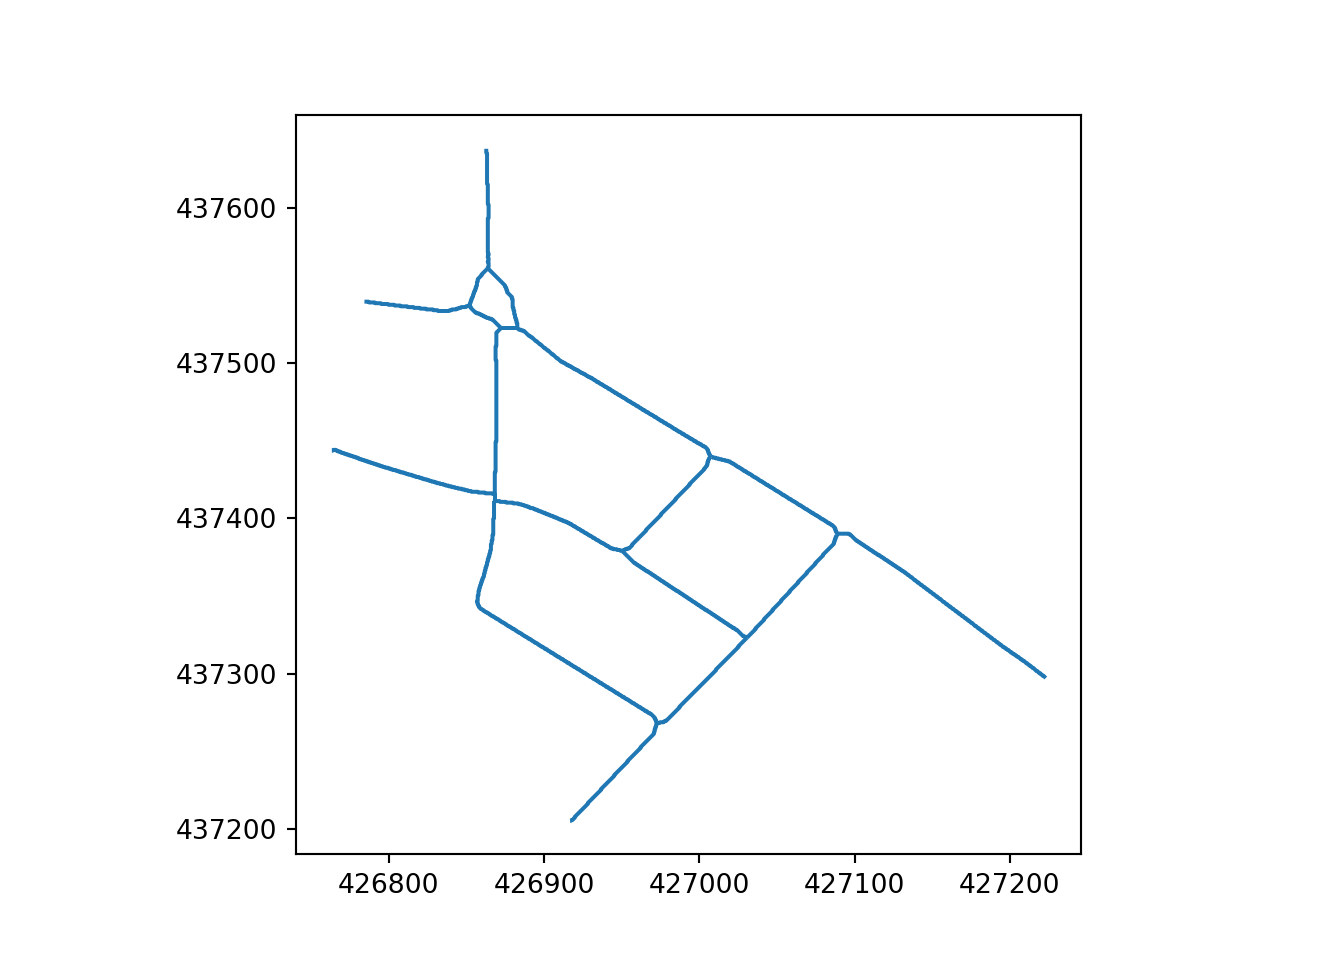
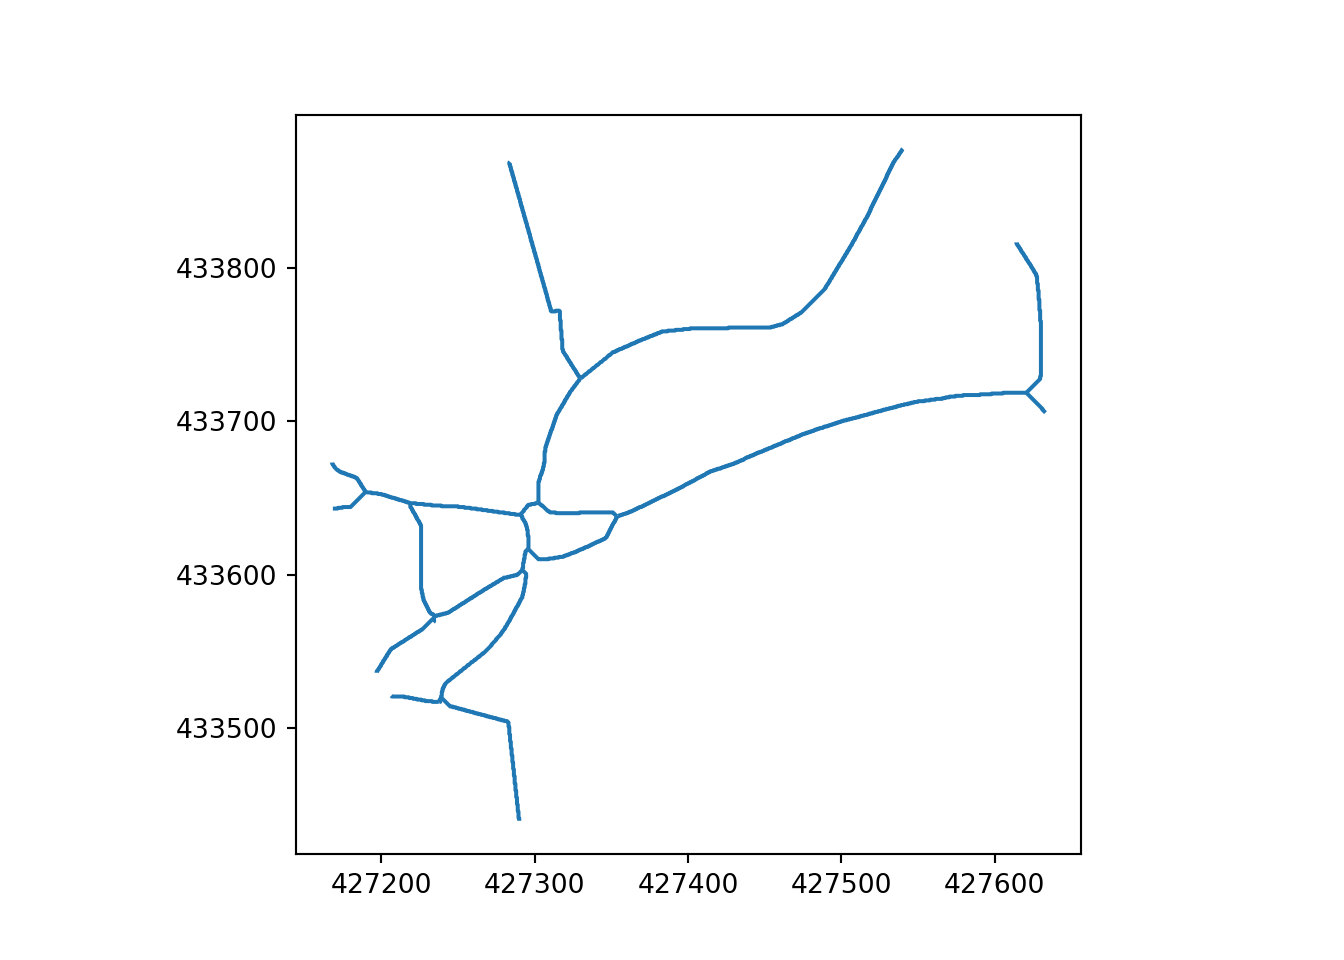
The resulting simplified network is illustrated in Figure 7.
3 Simplification via Voronoi polygons
In this approach, the network lines are first buffered as described above. The edges of these buffers are then segmented into sequences of points. From these sequences, a centre-line is derived based on a set of Voronoi polygons that cover these points. This approach facilitates the creation of a simplified network representation by focusing on the central alignment of the buffered lines.
3.1 Boundary Segmentation
In Figure 8, the boundary of the buffered input geometry (otley_geometry) is calculated and then simplified. This process yields a simplified GeoSeries consisting of LineStrings, all of which are precisely aligned with the specified coordinate reference system (CRS). This step illustrates the transformation from the initial buffer geometries, named ‘otley_buffer’ and ‘Armley_buffer’, to their more refined and simplified versions, ‘otley_boundary’ and ‘Armley_boundary’, respectively. These refined boundaries provide an accurate representation and visualization of the exact limits of the spatial objects involved.
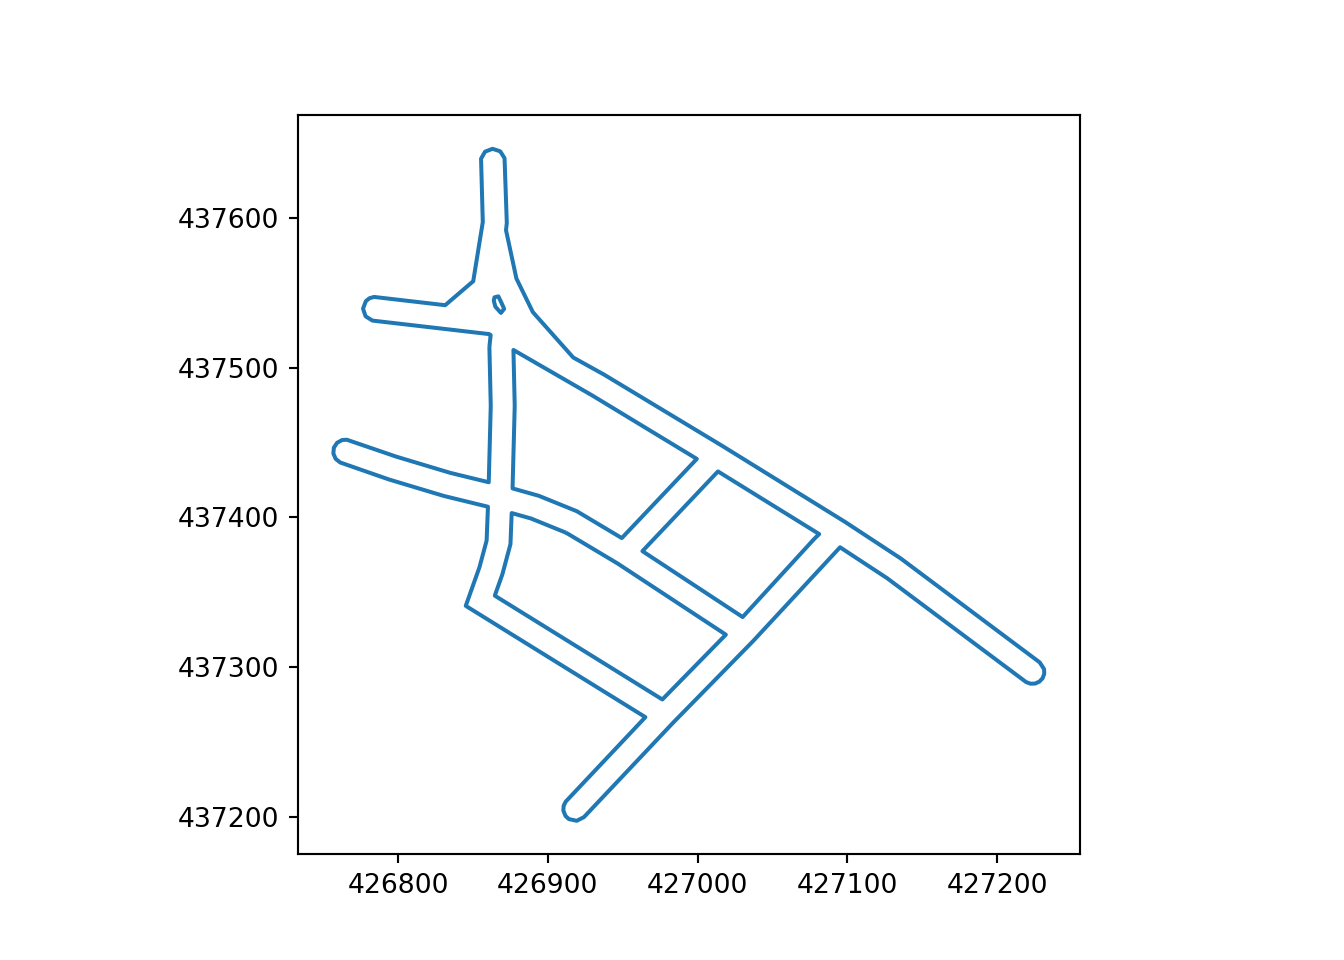
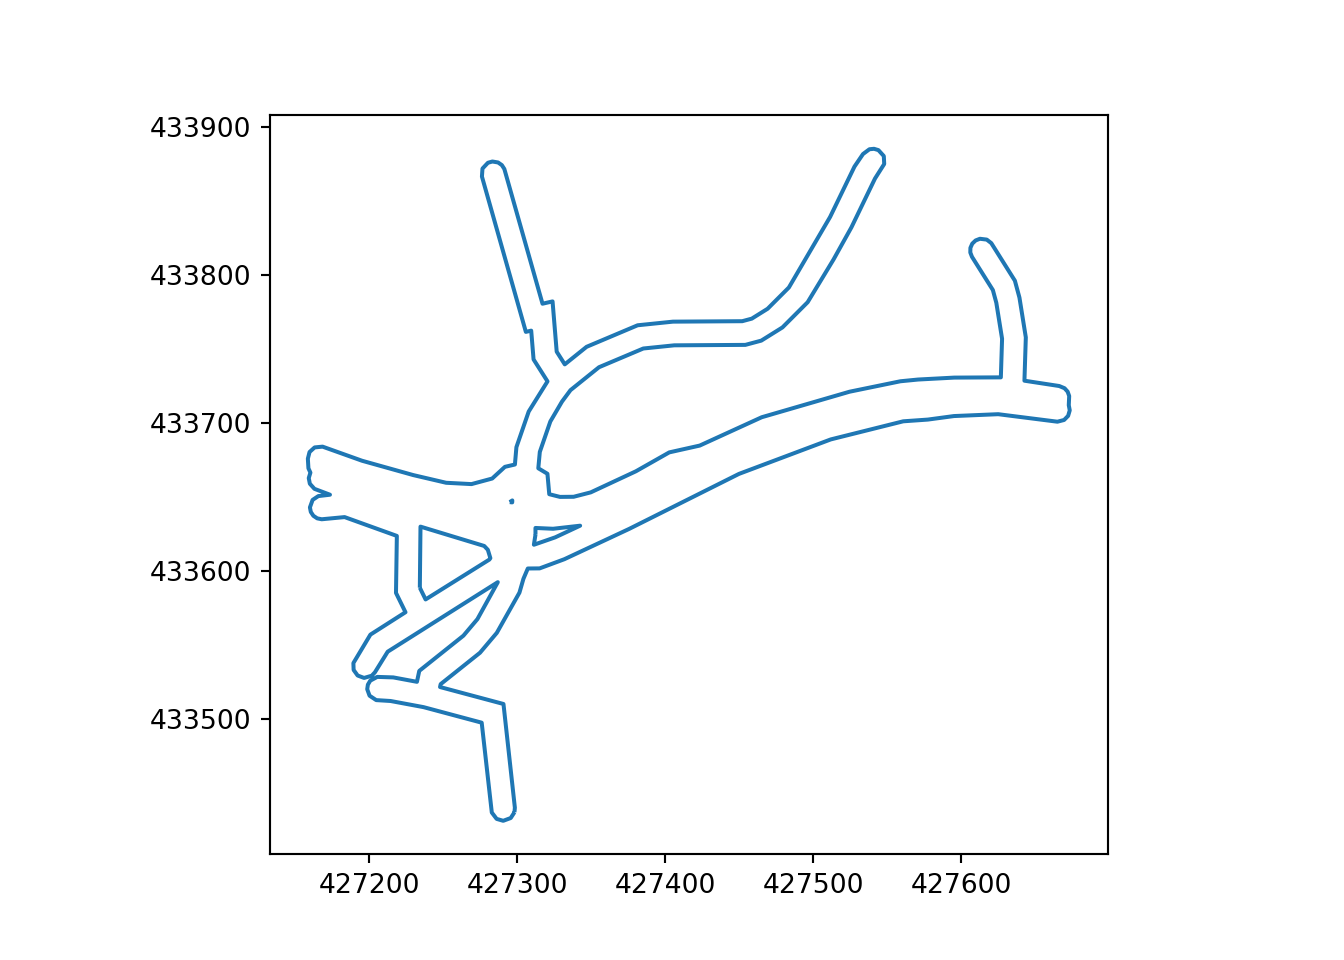
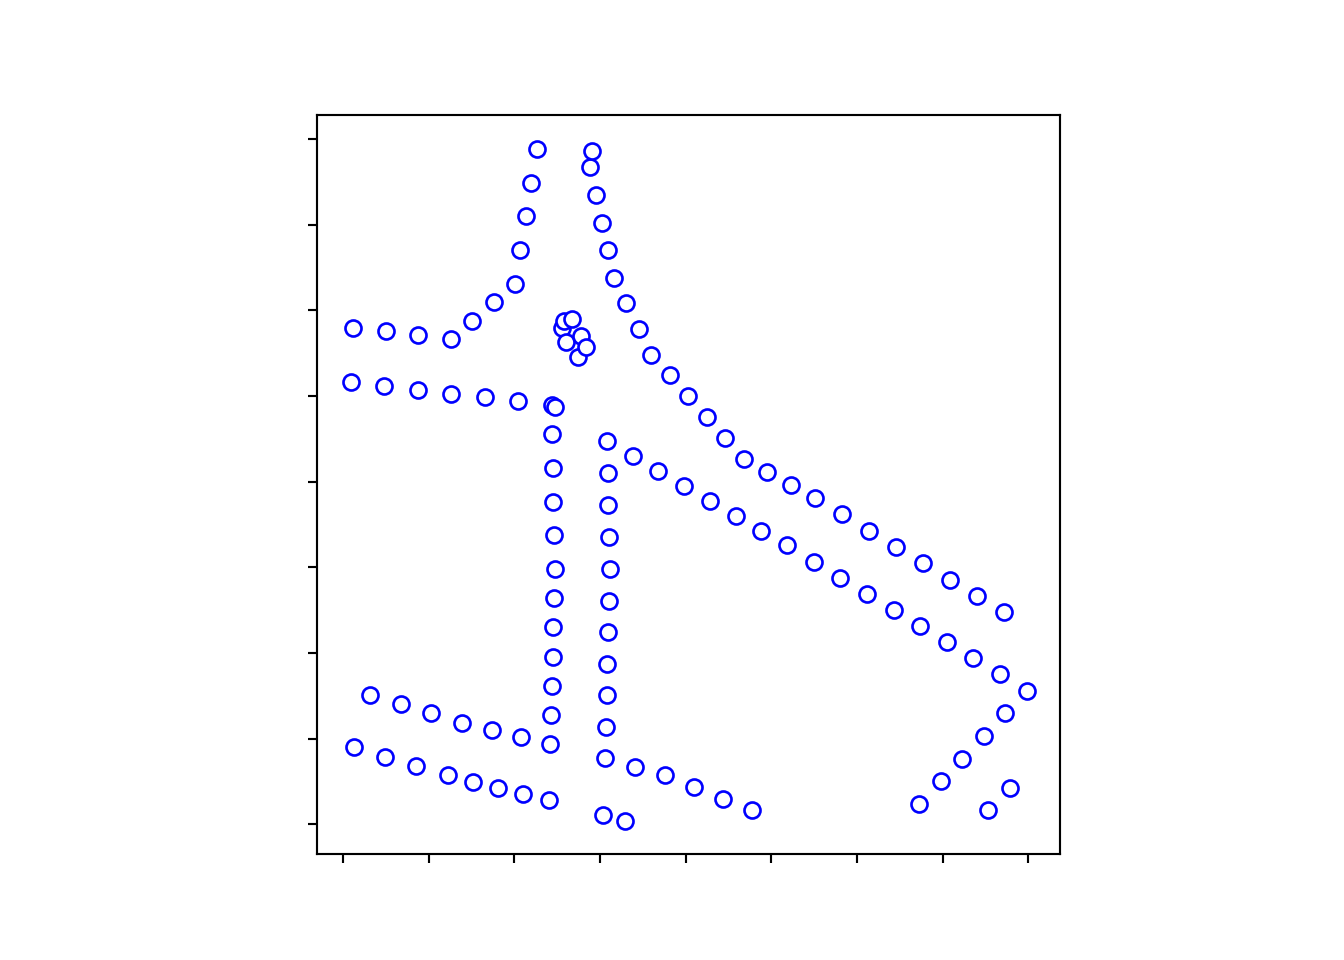
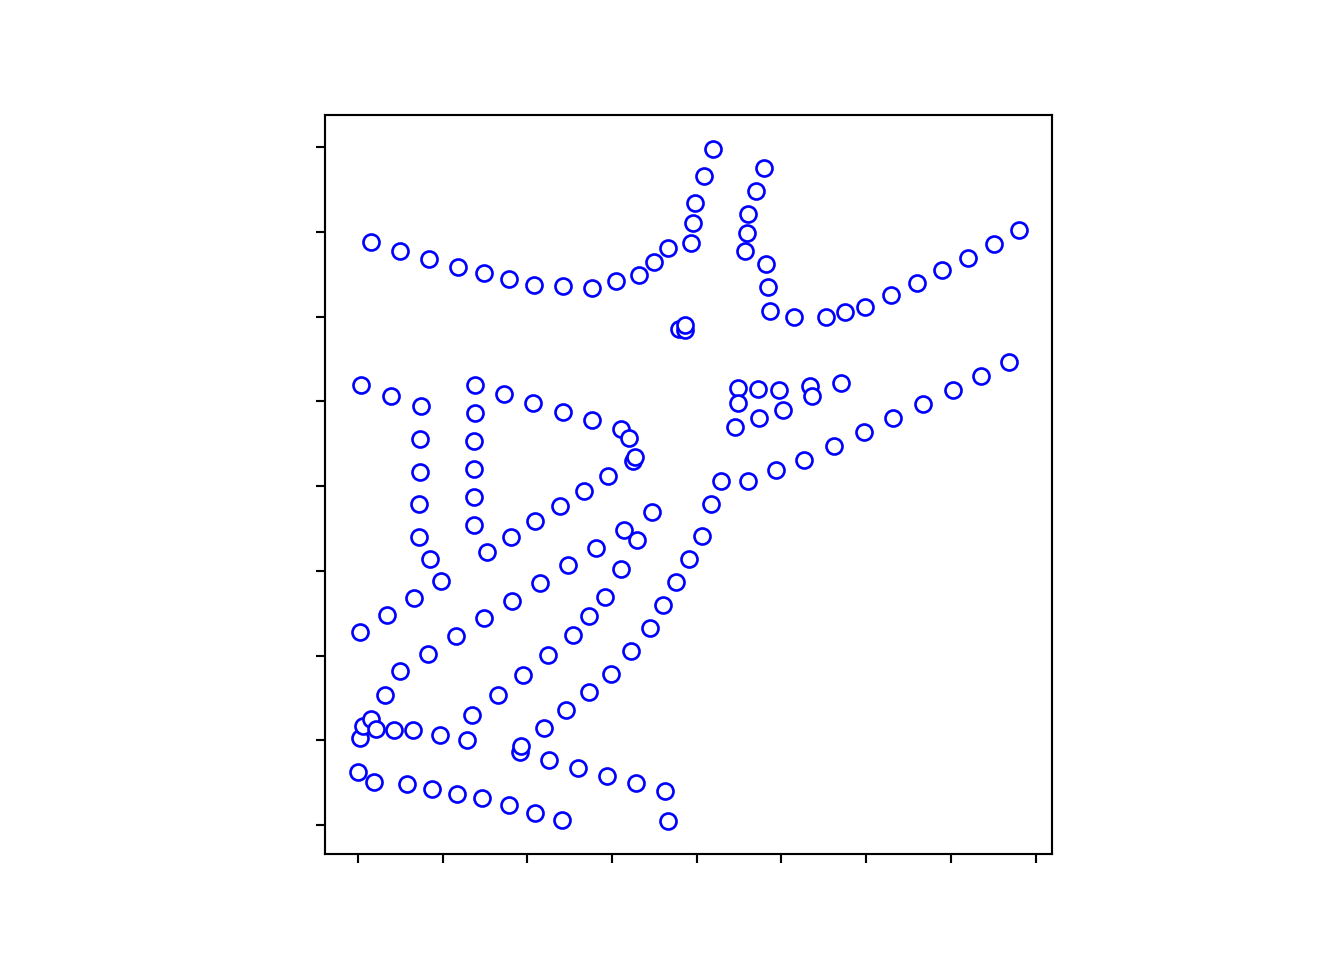
Figure 9 showcase the conversion of segmented LineString geometries into point geometries. This essential transformation forms the basis for constructing Voronoi diagrams.
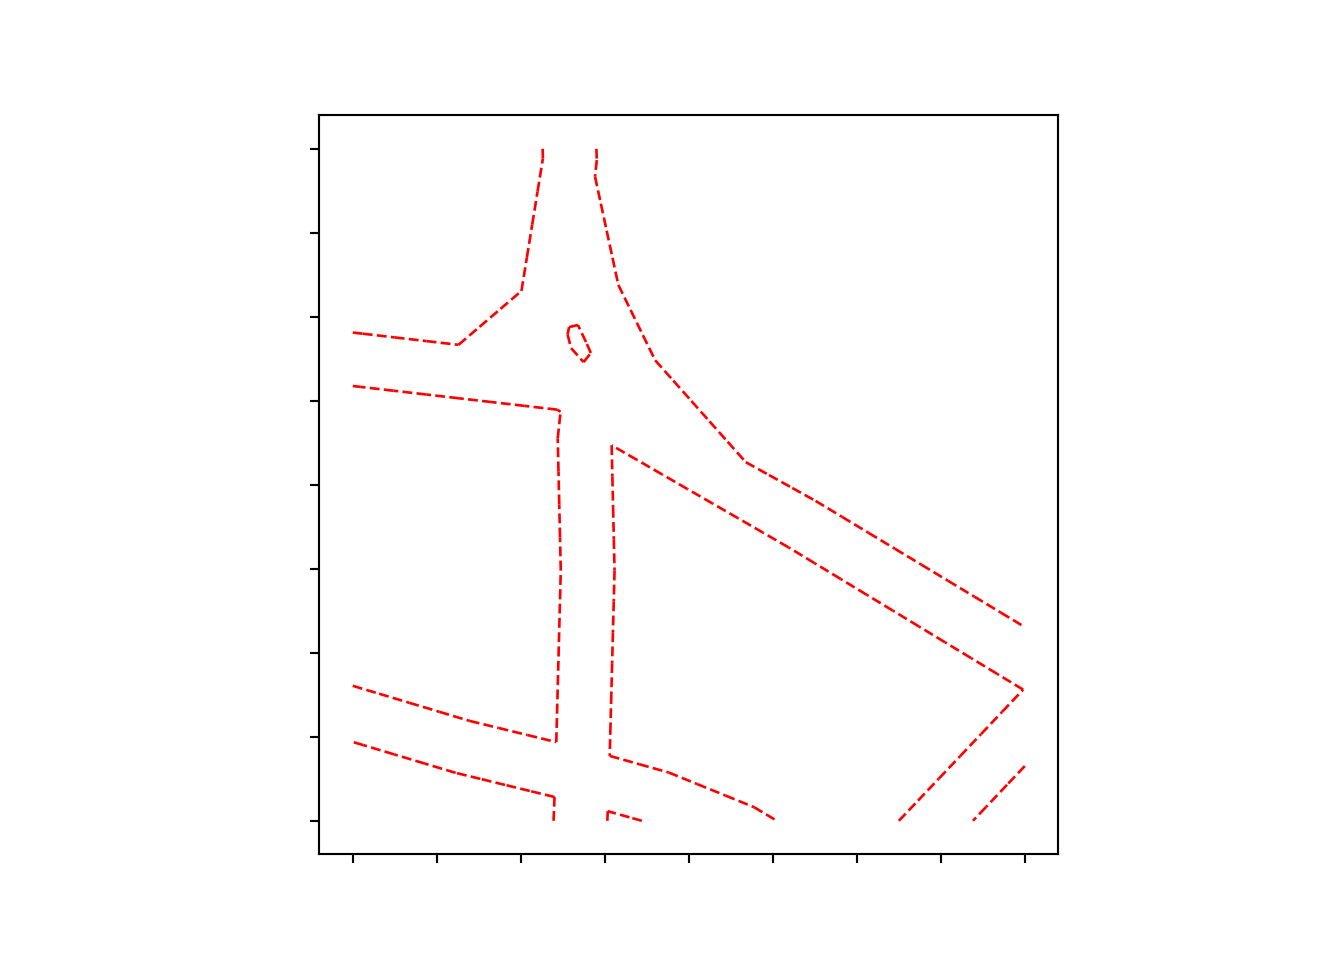
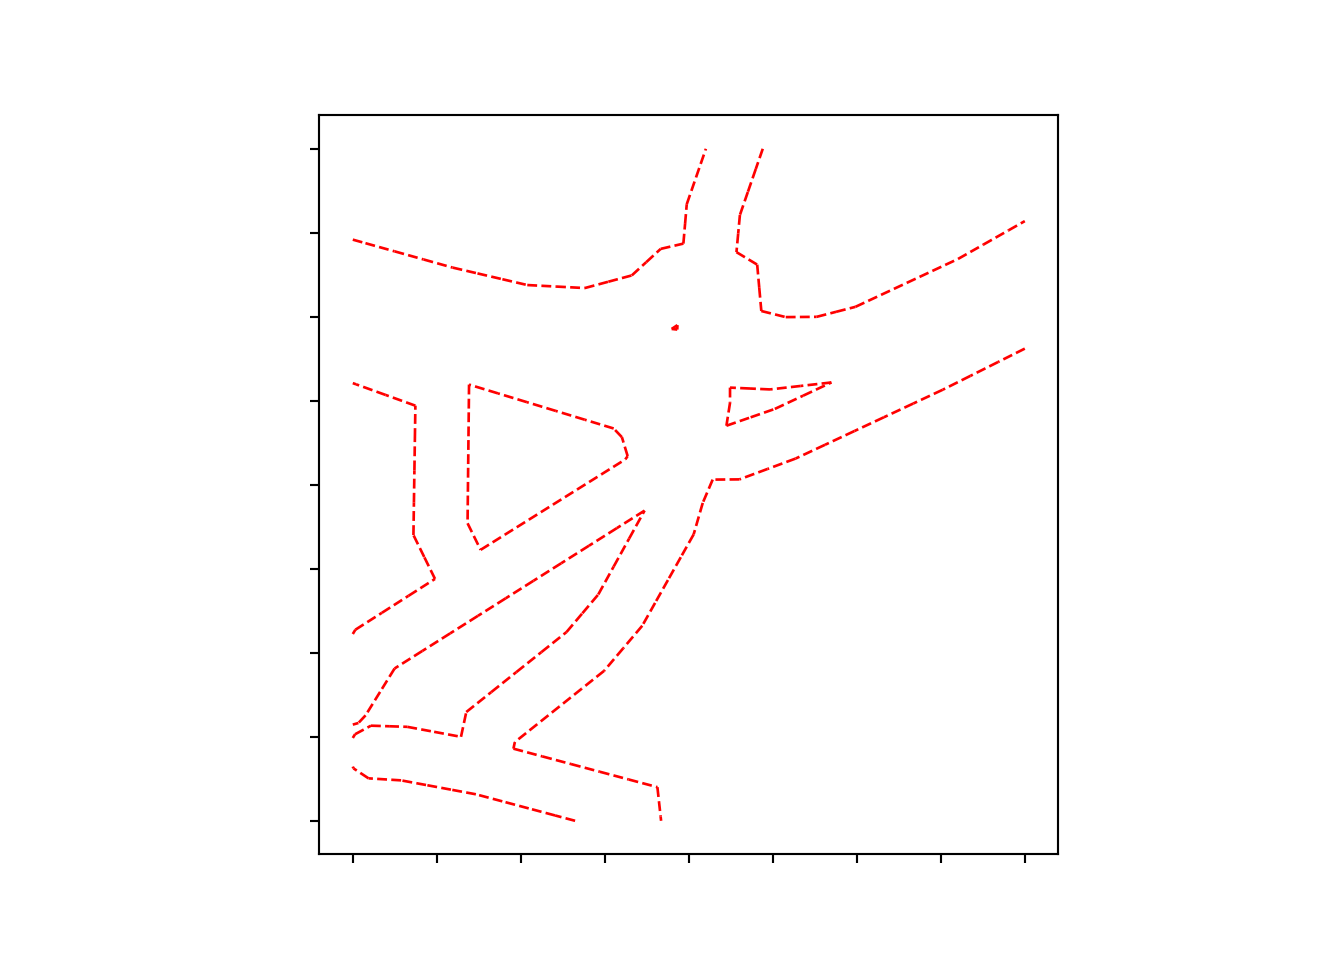
Figure 10, the process of converting the segmented LineString geometries into point geometries is illustrated. This transformation is essential for the creation of Voronoi diagrams.
3.2 Voronoi diagram simplification
In Figure 11, the generation and clipping of the corresponding Voronoi diagrams to the bounds of the input geometry is depicted.

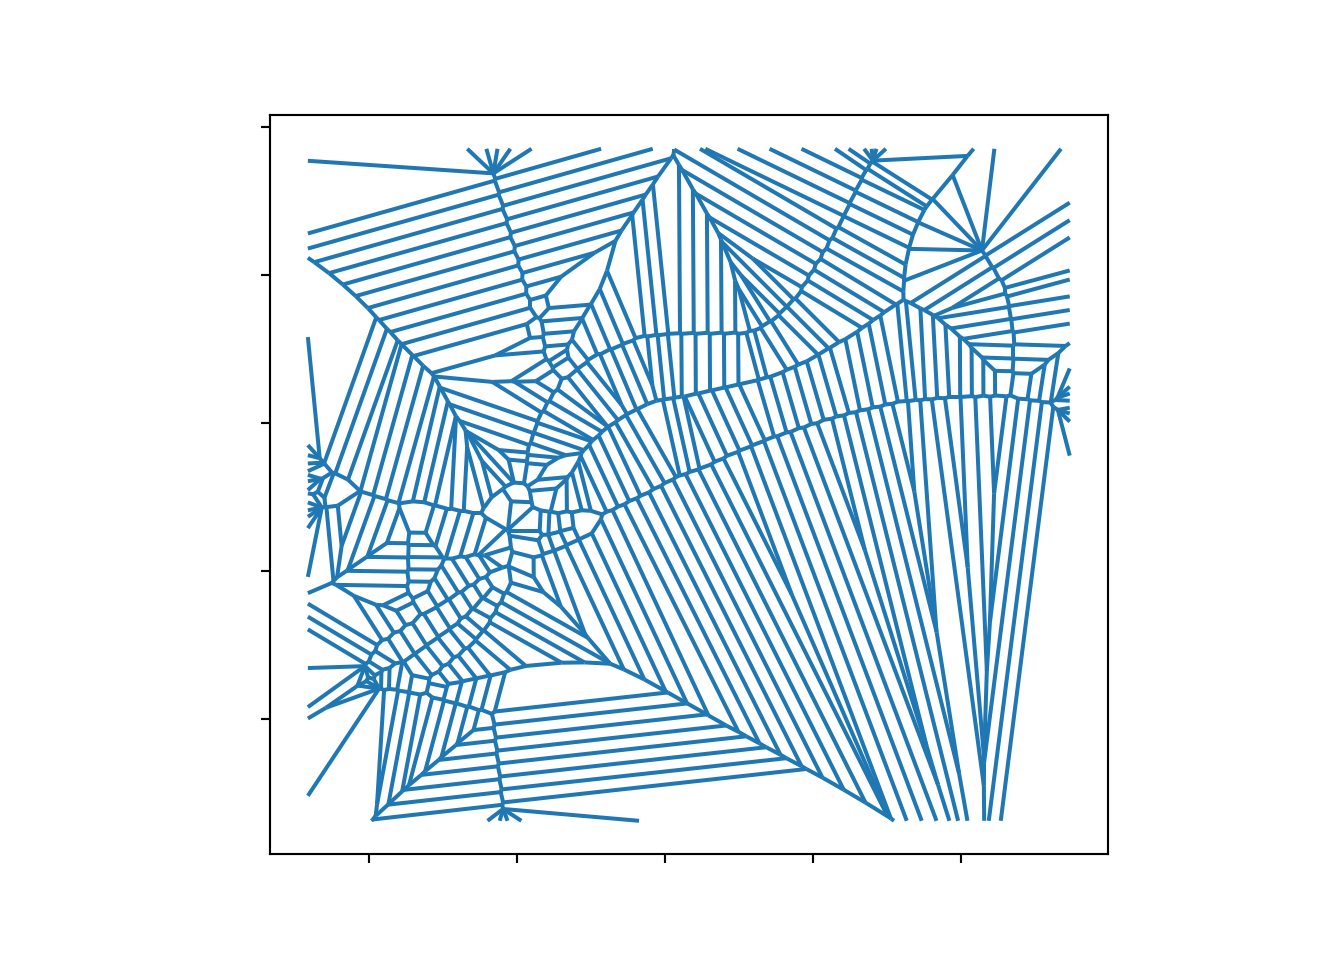
Figure 12 shows the Voronoi lines that are completely enclosed within the buffer geometry and are situated at a distance of less than half the buffer’s width from the buffer edge. This selective visualization of Voronoi lines effectively demonstrates the method precision in capturing and representing the central alignment of the transport network within its buffered confines.
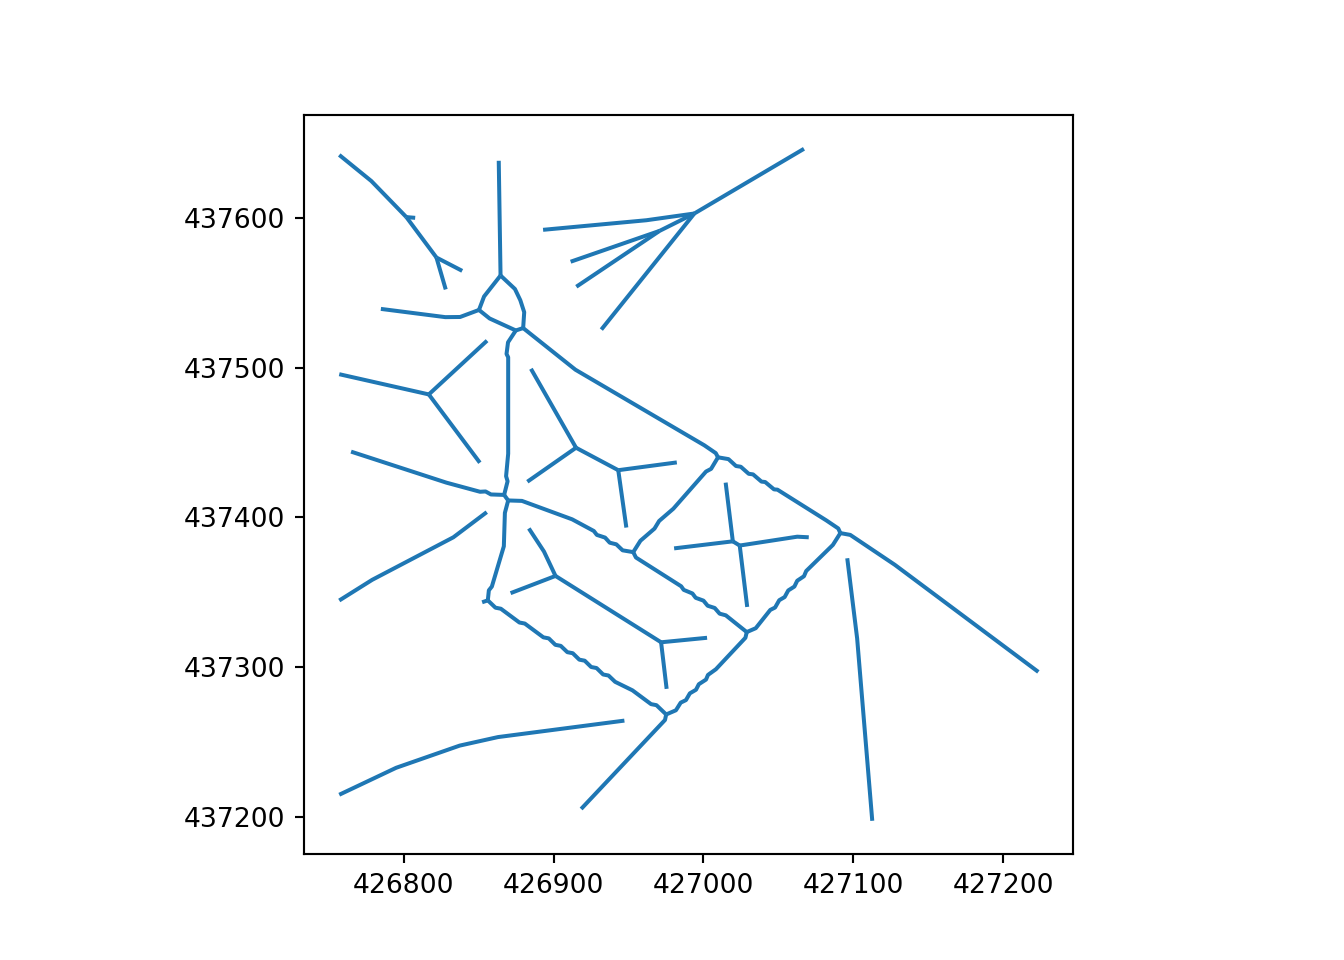
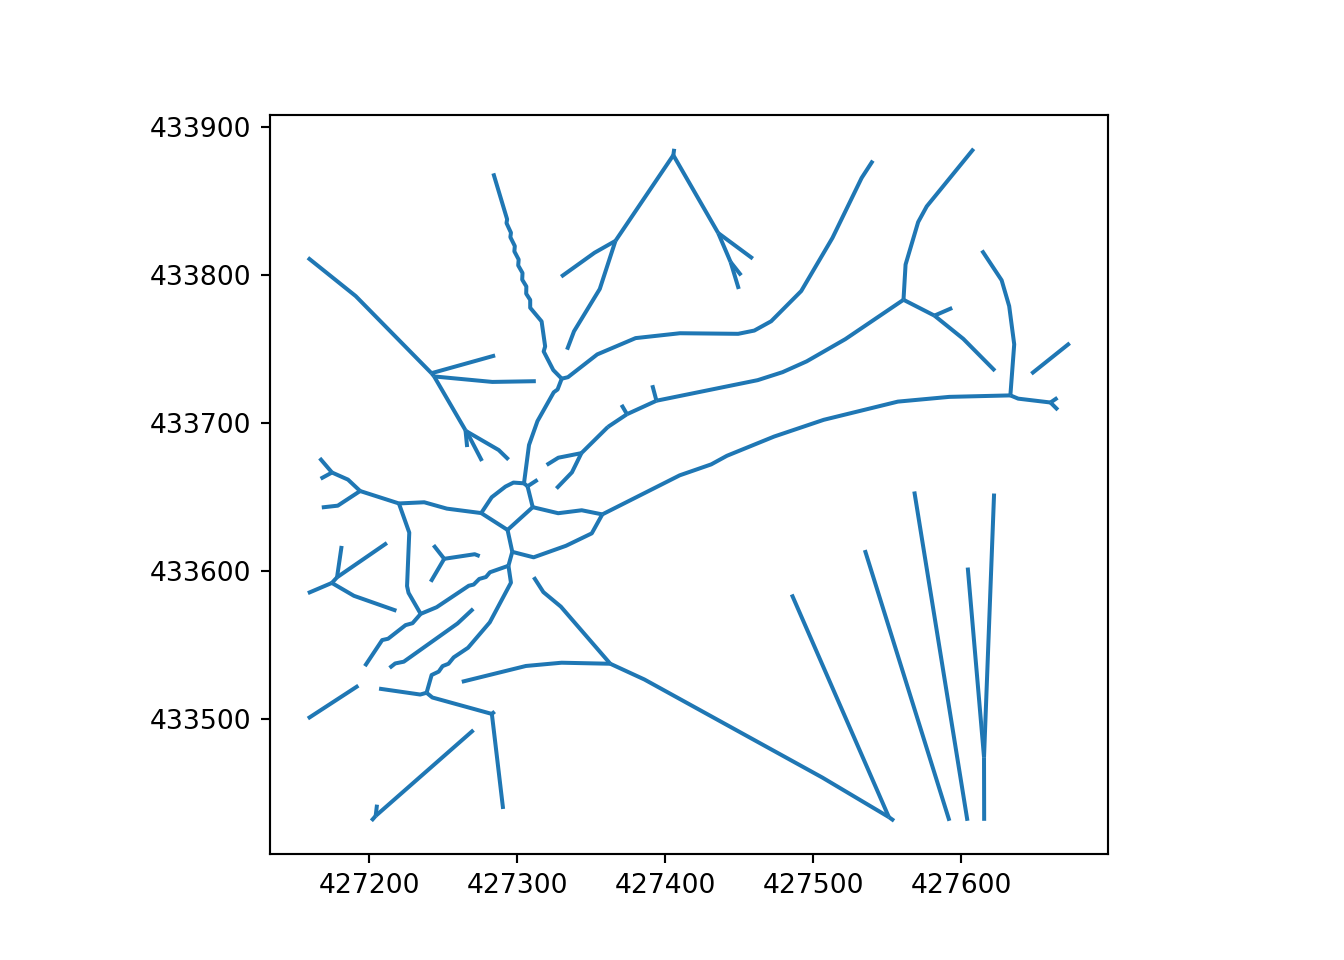
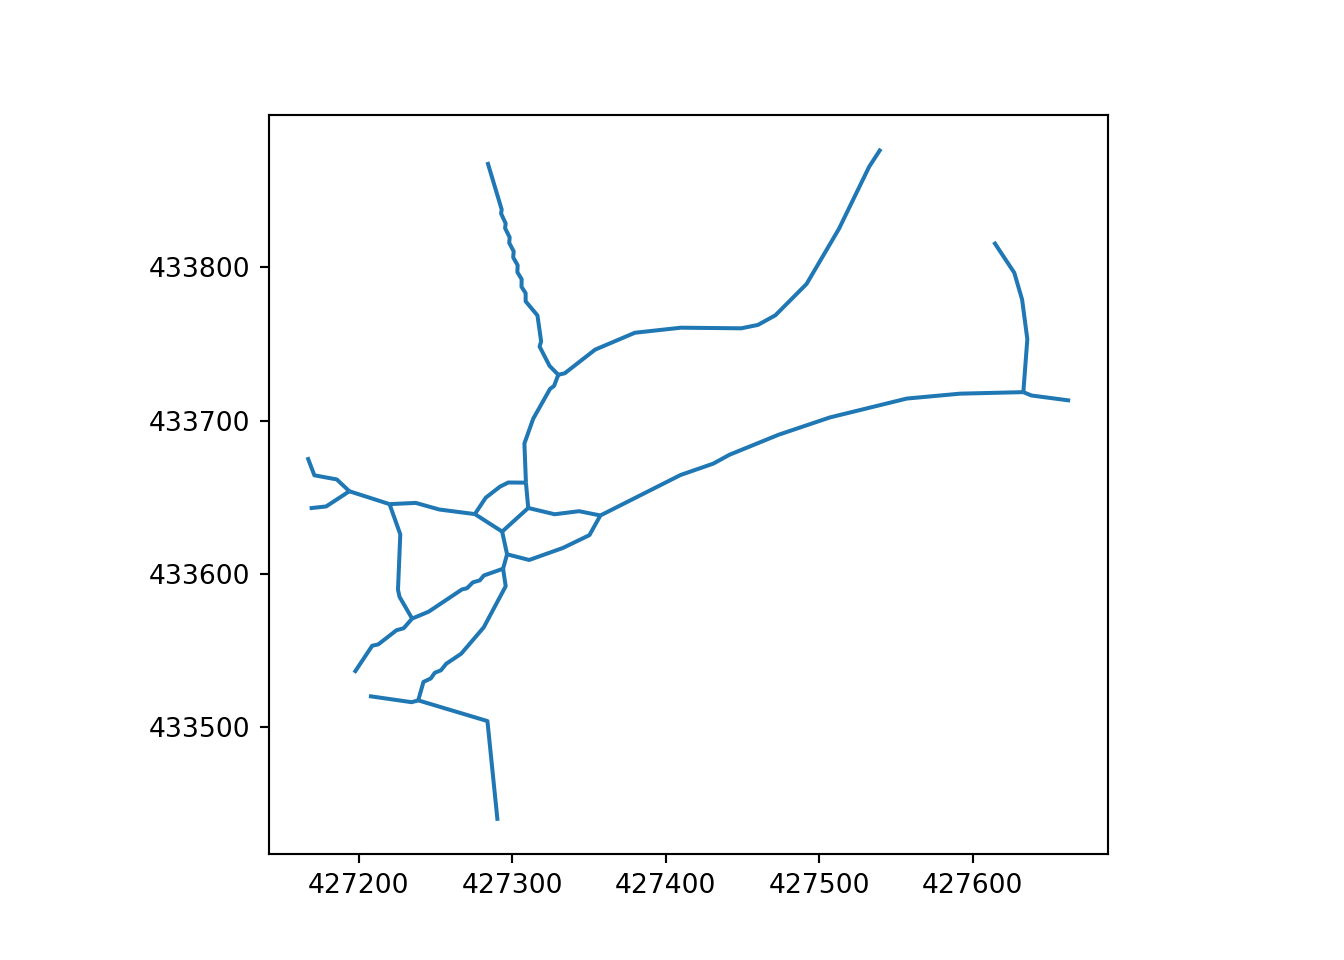
The final center-line network shown in Figure 13 is created through a clean up process that involves the removal of knot-like features from the simplified network. While knots common to both skeletonization and Voronoi simplification, these artefacts are more prevalent on Voronoi simplified networks.
4 Post-Processing
Both skeletonization and Voronoi simplified networks require post-processing to remove unwanted knots. Optionally by removing intermediate lines-sections, a further simplified or primal network that captures the essential connectivity and layout of transport routes can be generated.
4.1 Knots
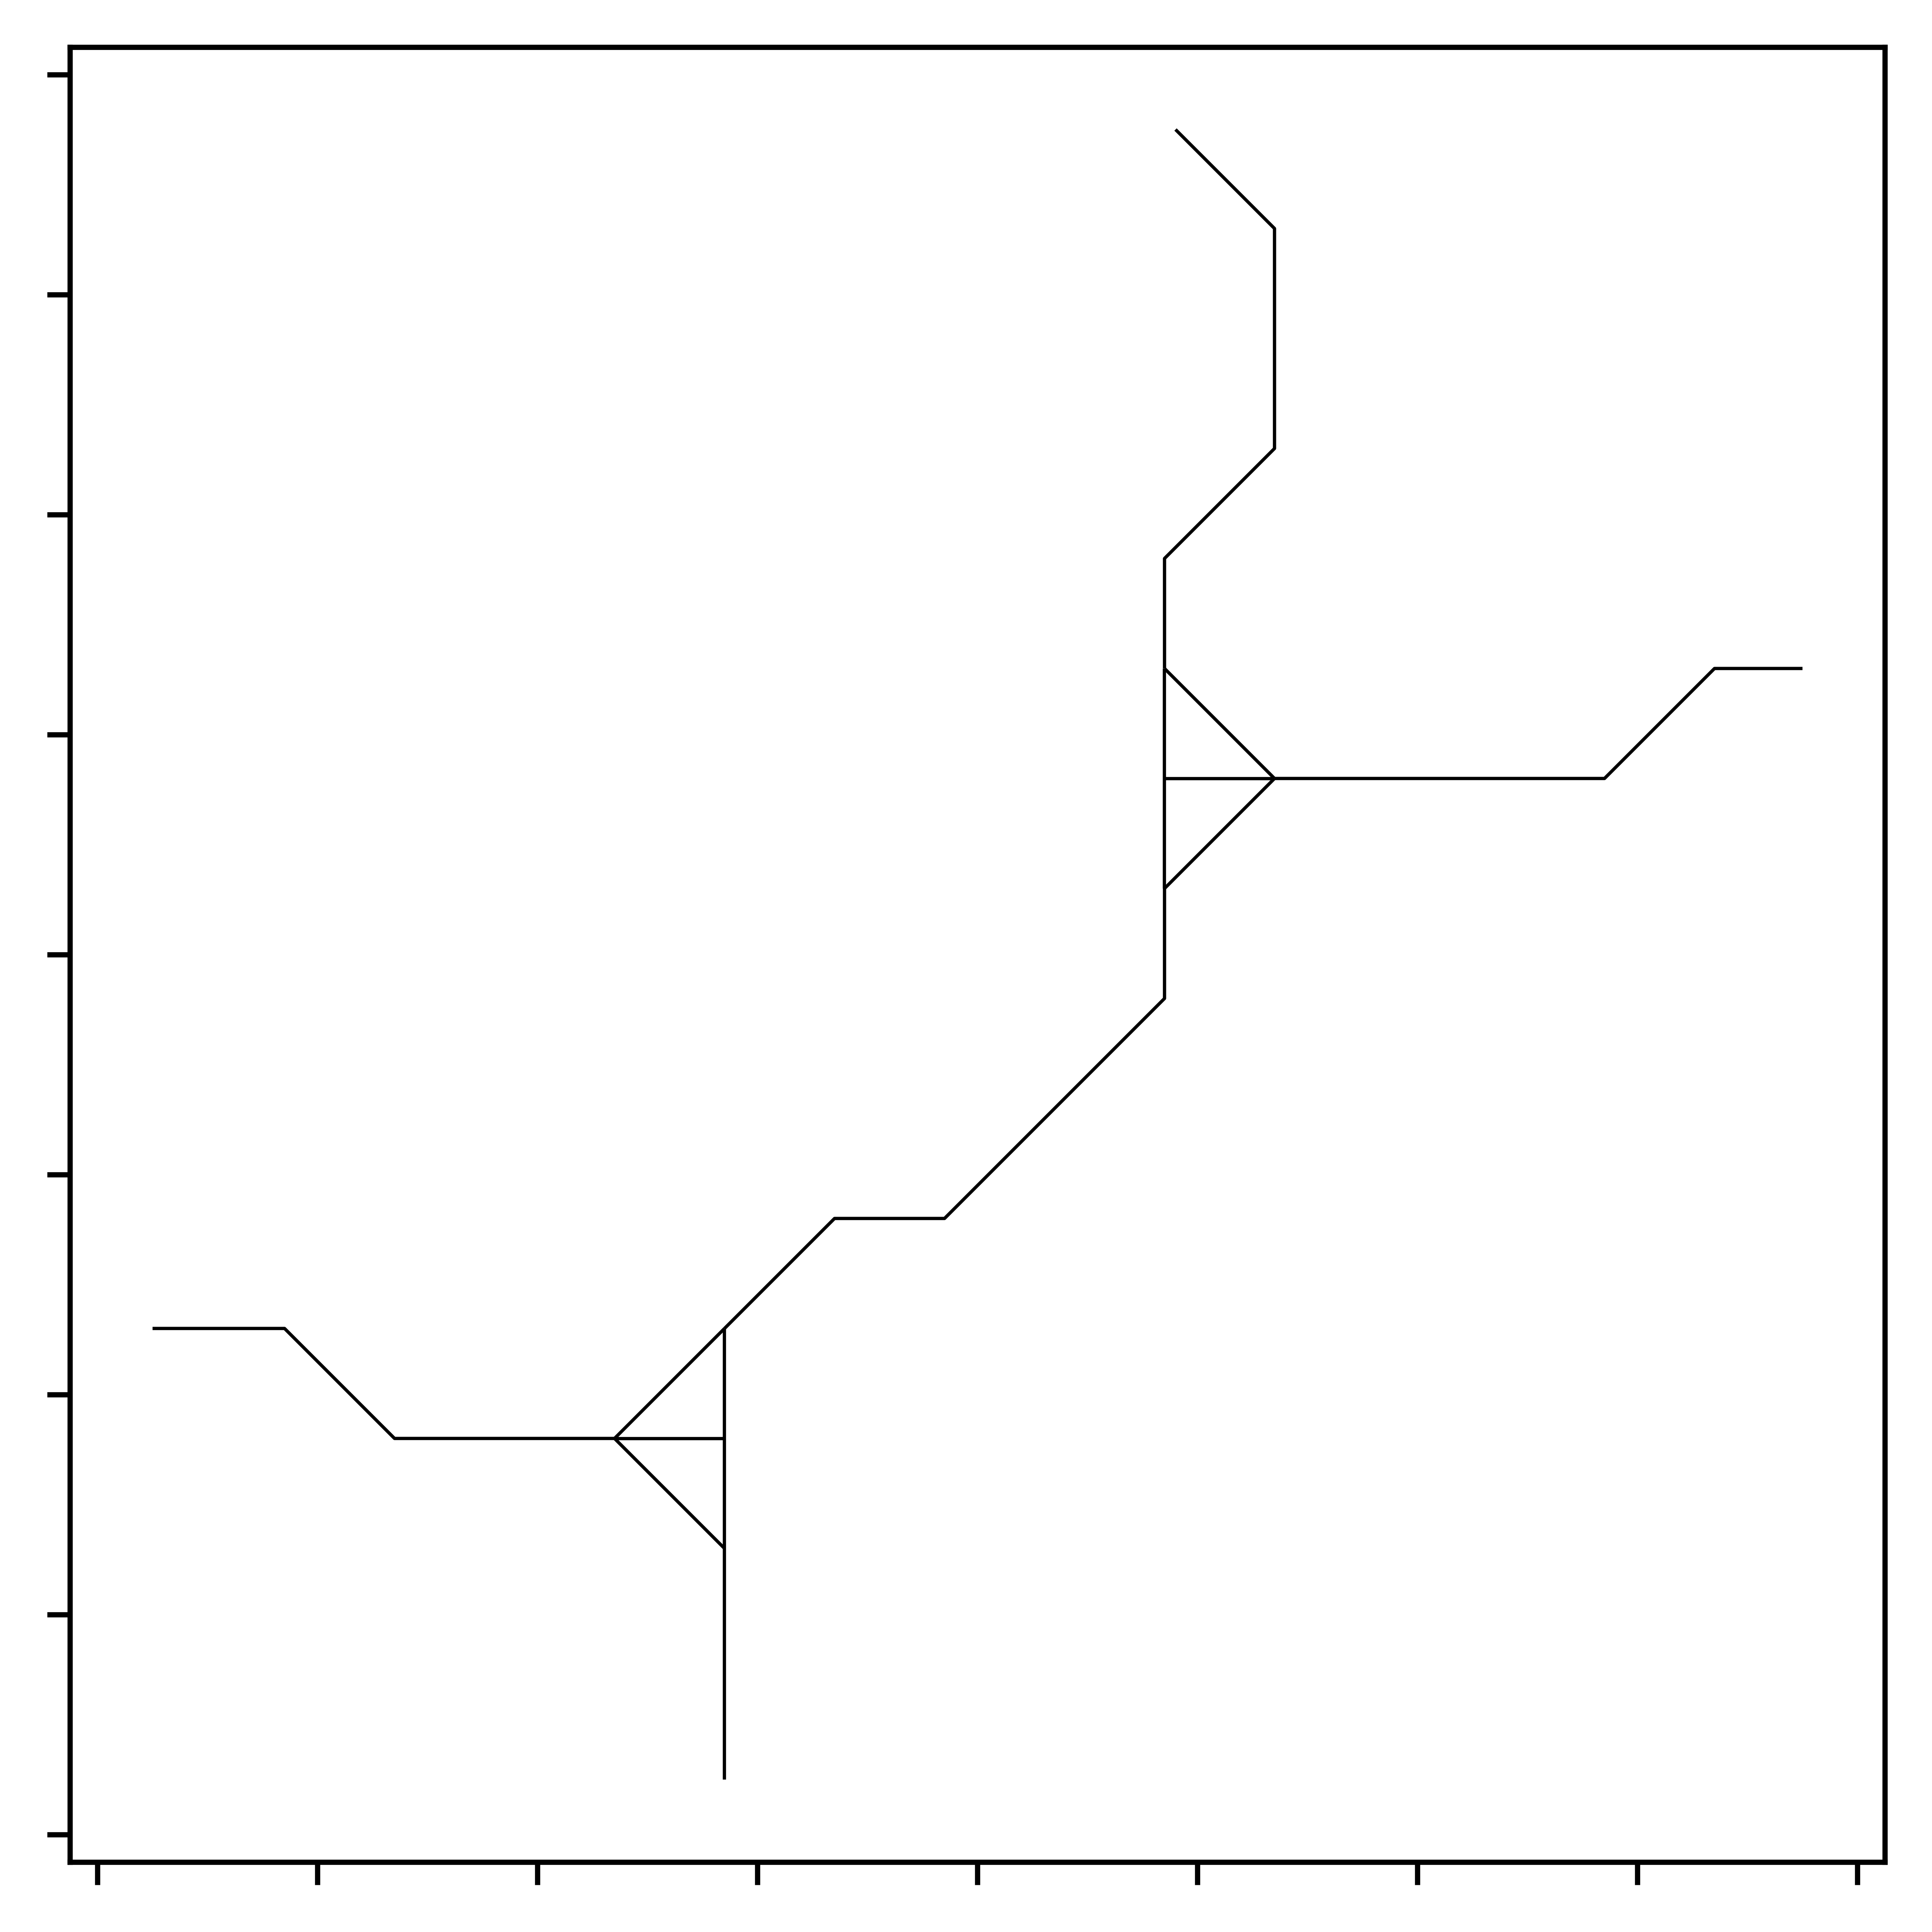
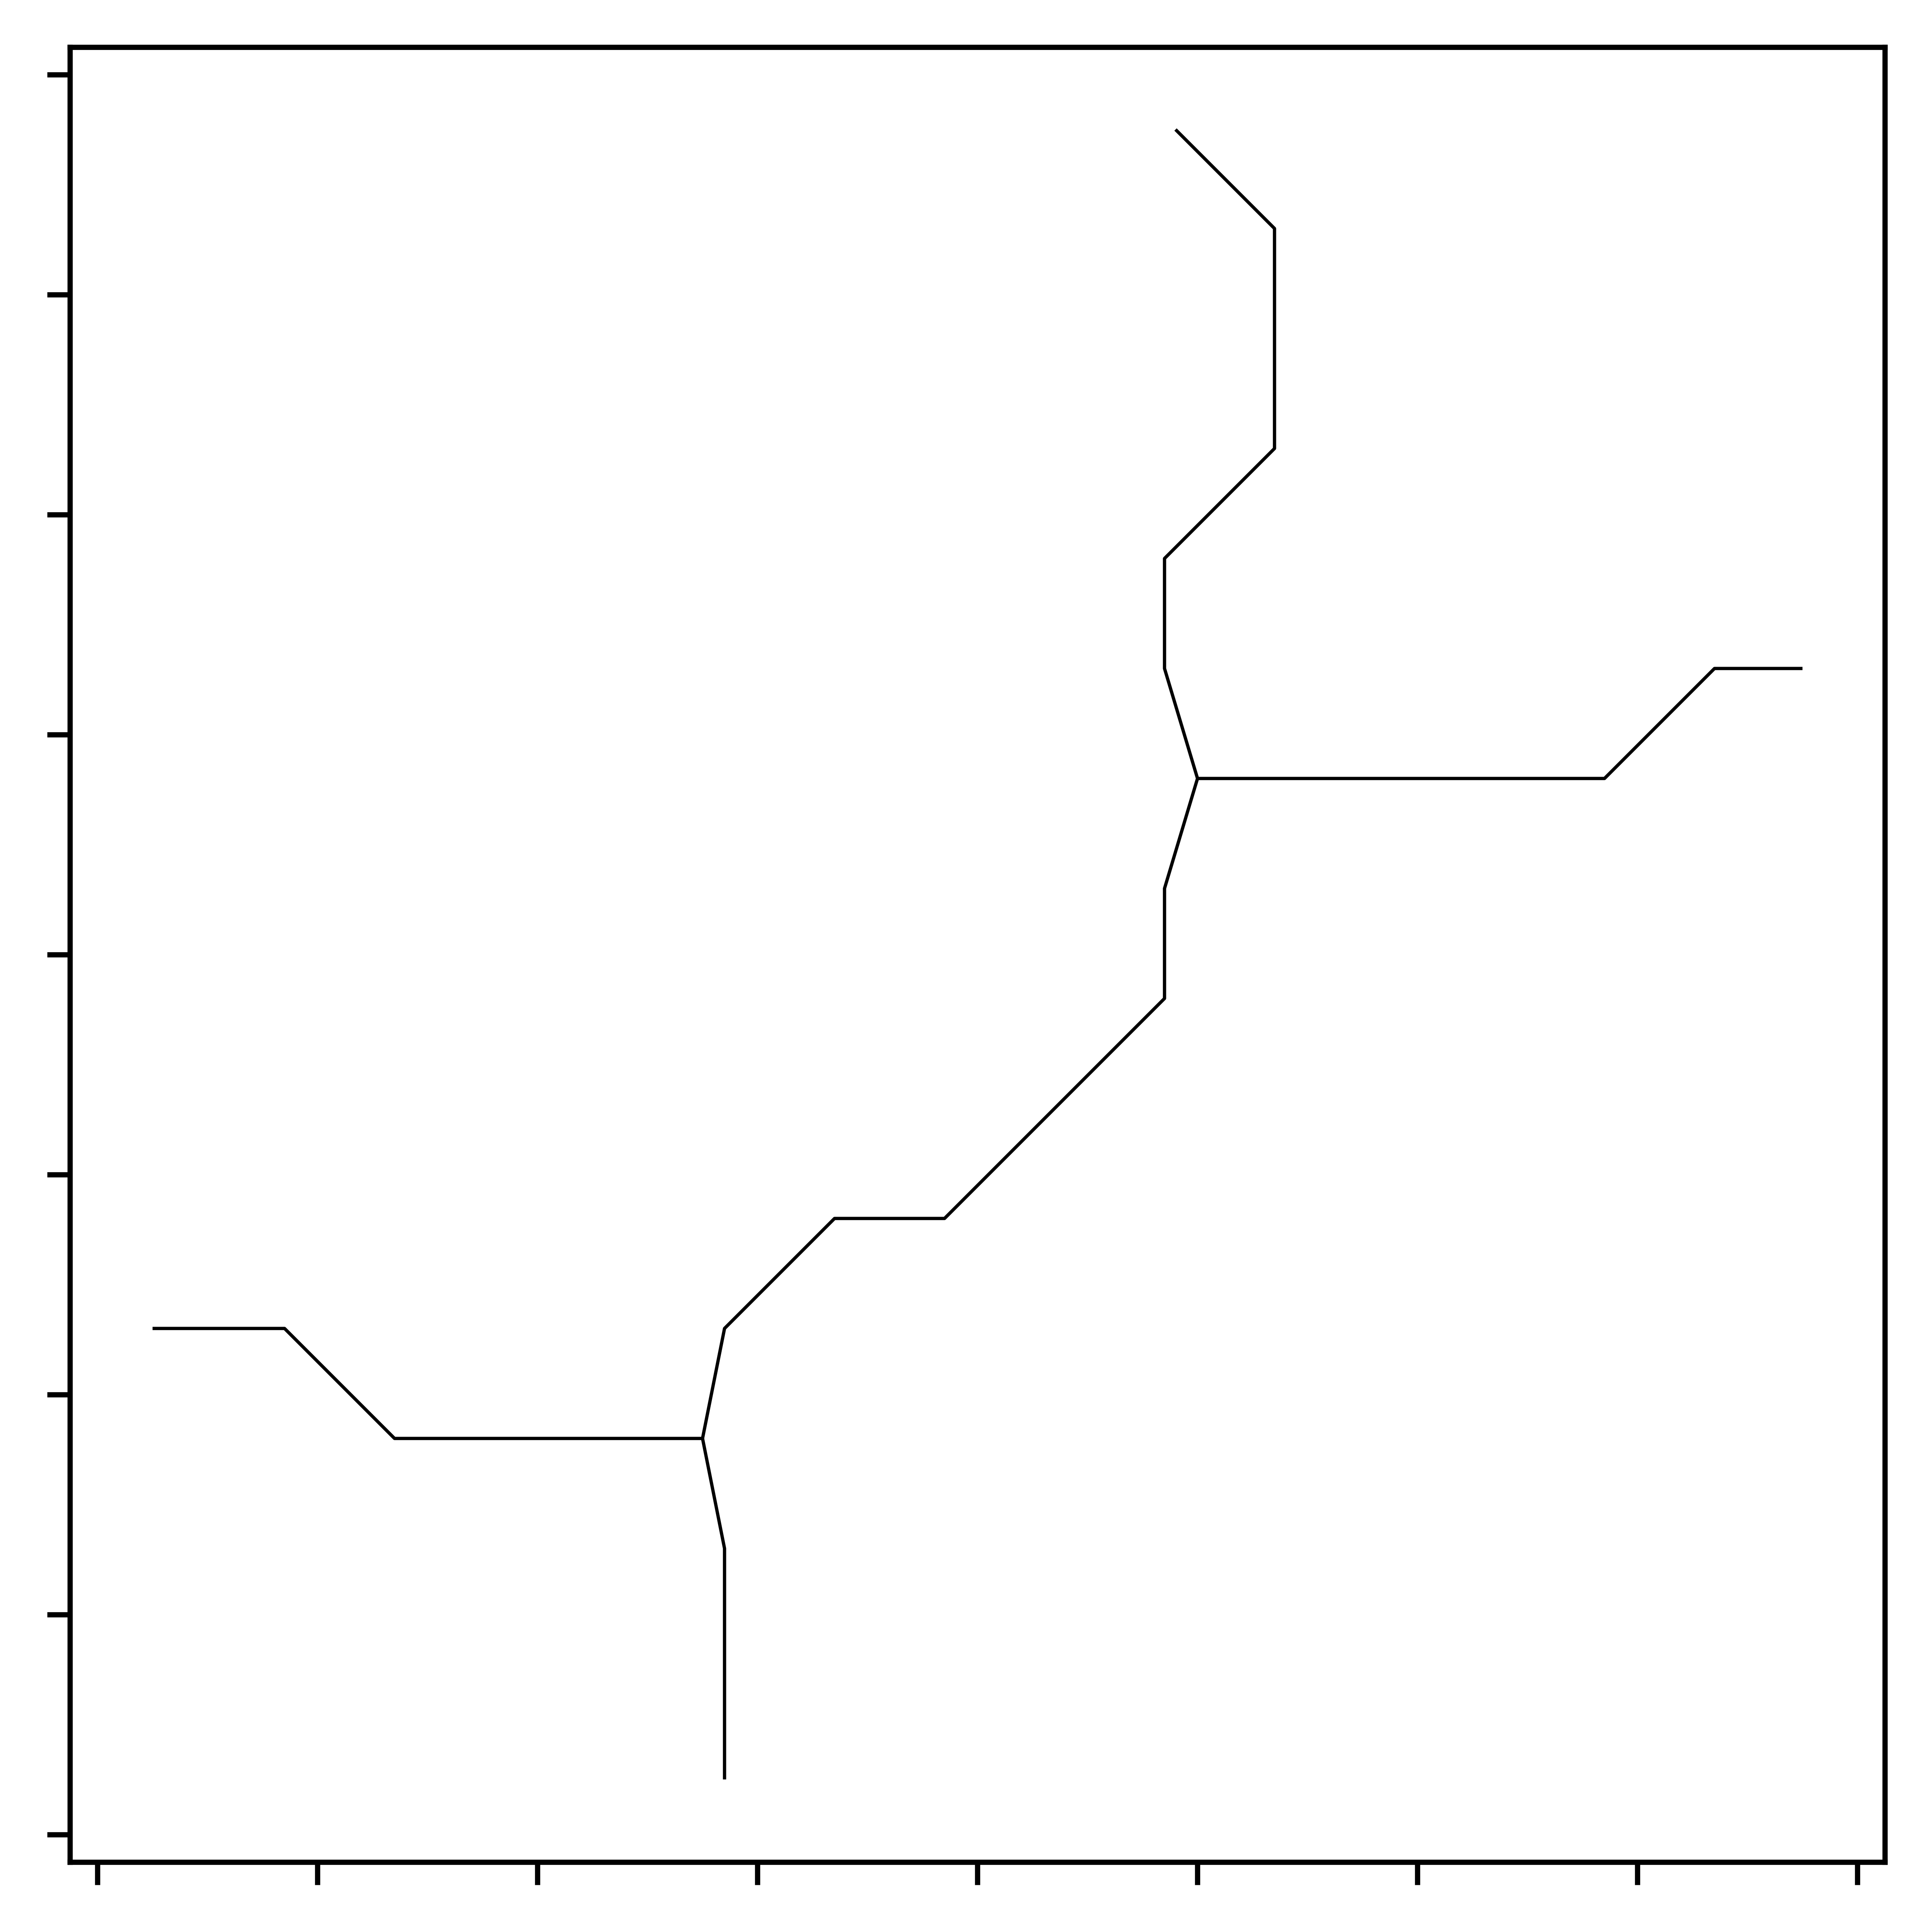
Knots in the network are multiple short segments at intersections, resembling tangled knots. To remove these features of networks, which add complexity that is rarely relevant for strategic transport planning, short segments are clustered together, and a central point for each cluster is determined. The end-points of longer lines that connect to these segment clusters are then realigned to the cluster’s central point. This process effectively removes the knot-like appearance. As with previous steps, the reverse affine transformation is applied to the simplified network before plotting, ensuring the network is represented in its original spatial context, as illustrated in Figure 14.
4.2 Primal network
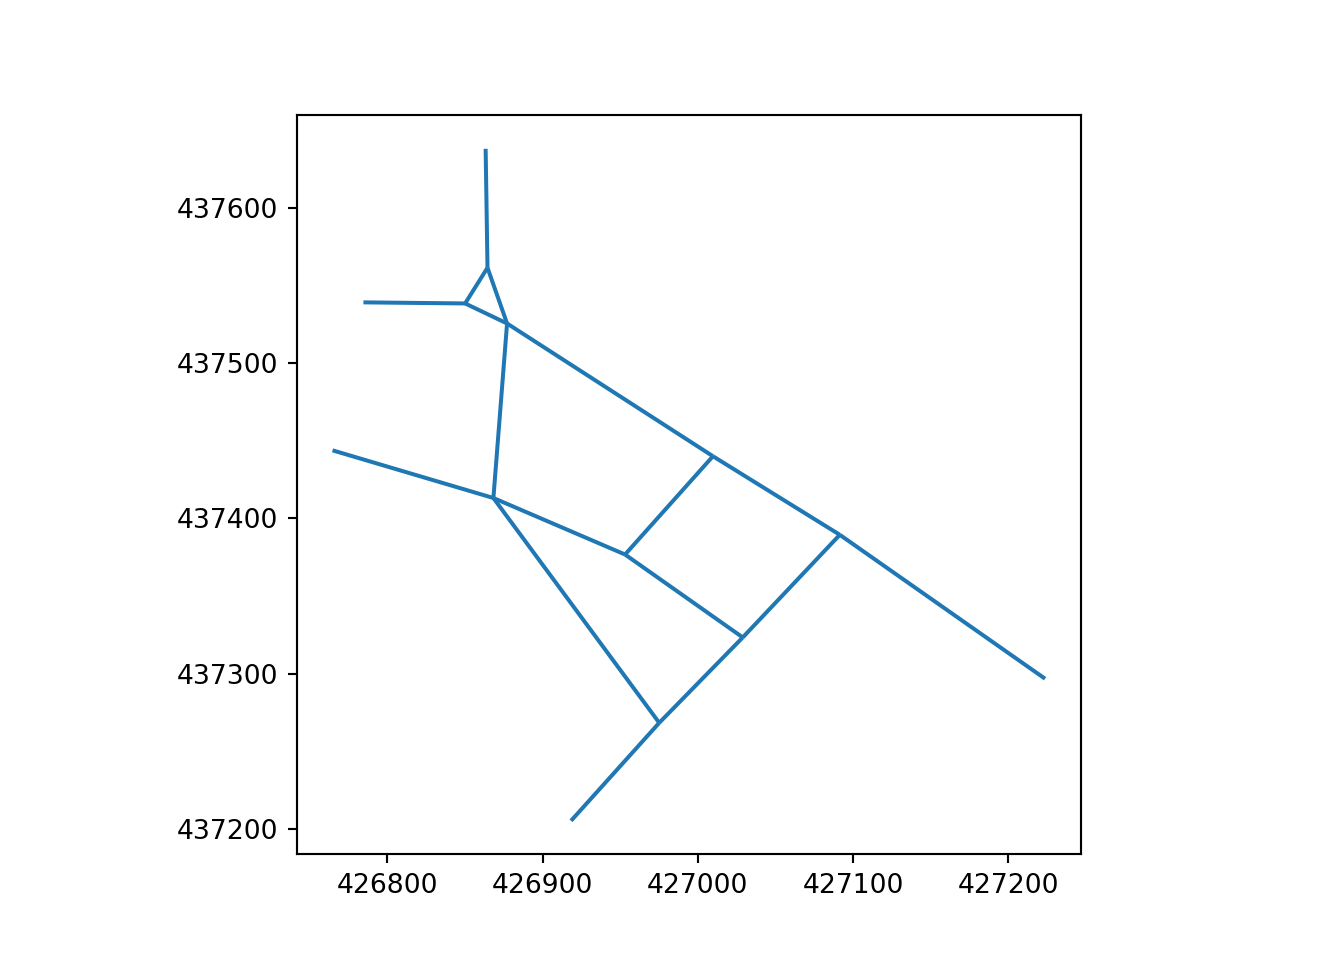
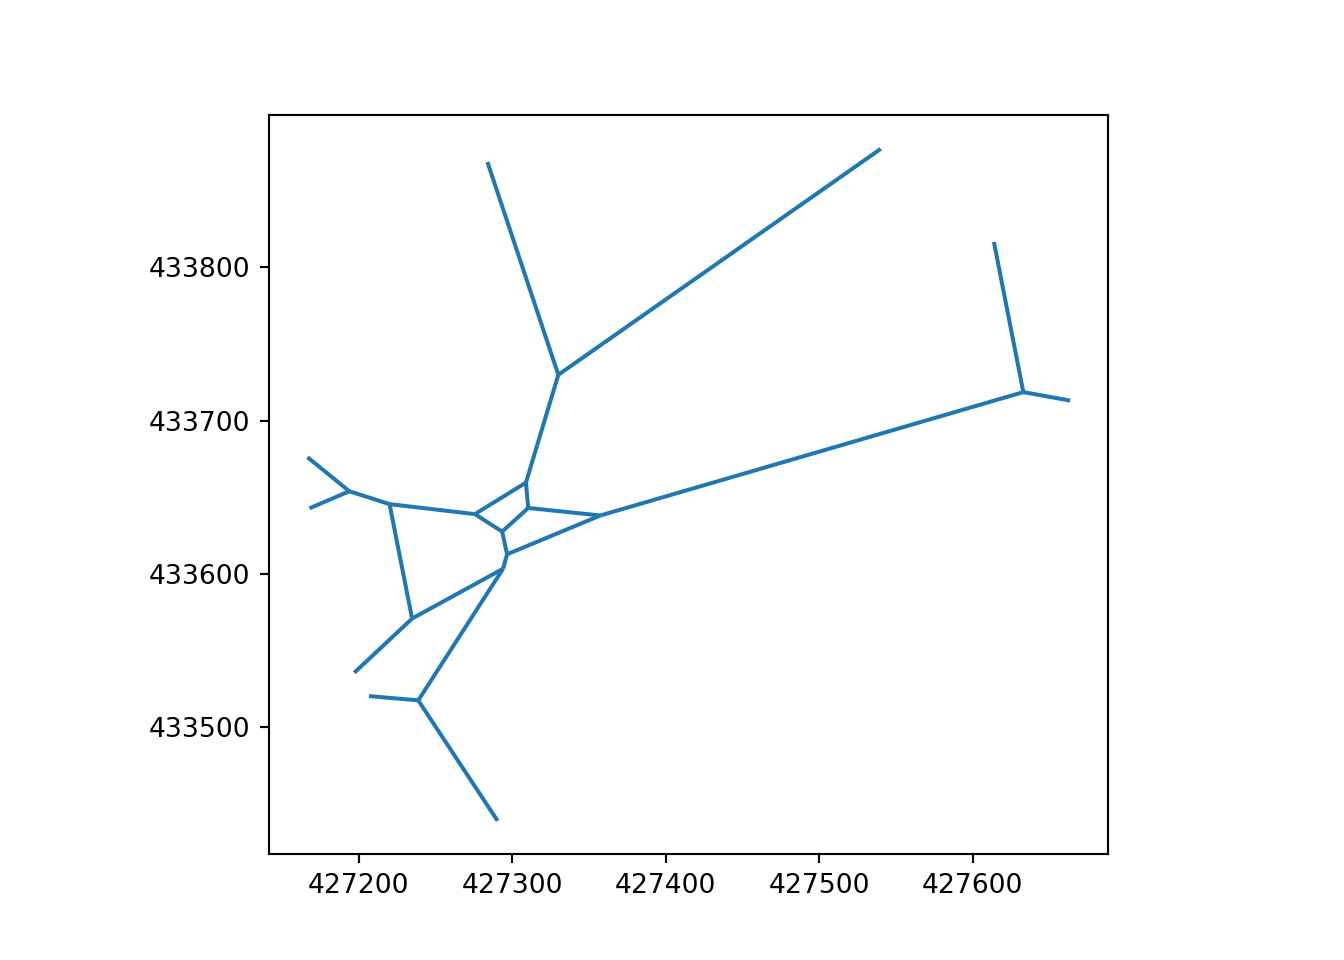
There are circumstances where it might be beneficial to view a “primal” network, which is exclusively composed of direct lines connecting start and end points. This primal network represents an extreme form of simplification, of great potential value in situations in which the network’s overall structure and compression ratios are priorities.
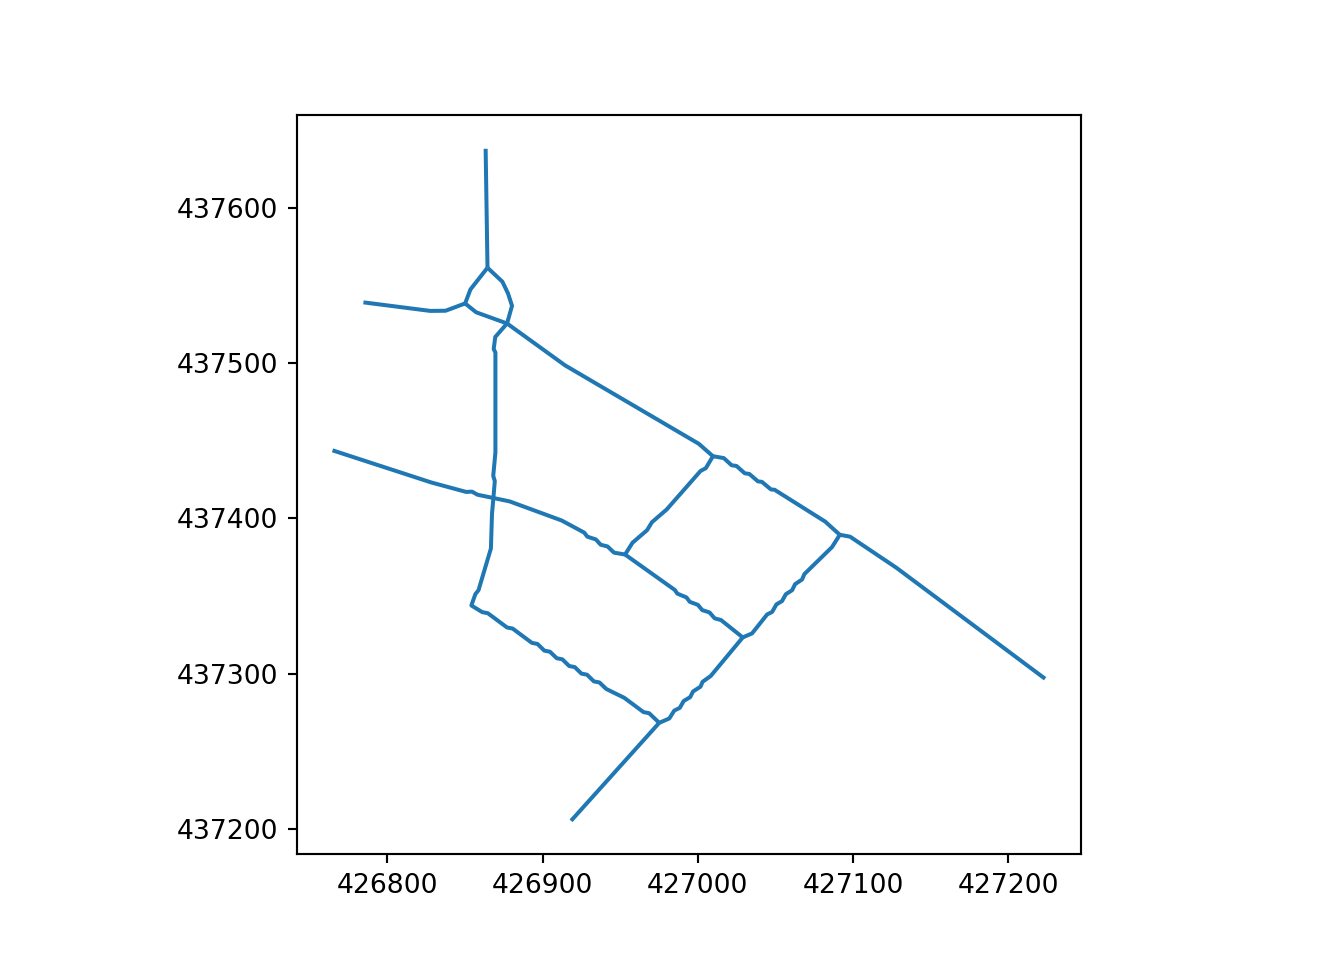
The primal networks for the Otley Road and Armley Road skeletonized networks are illustrated in Figure 15.
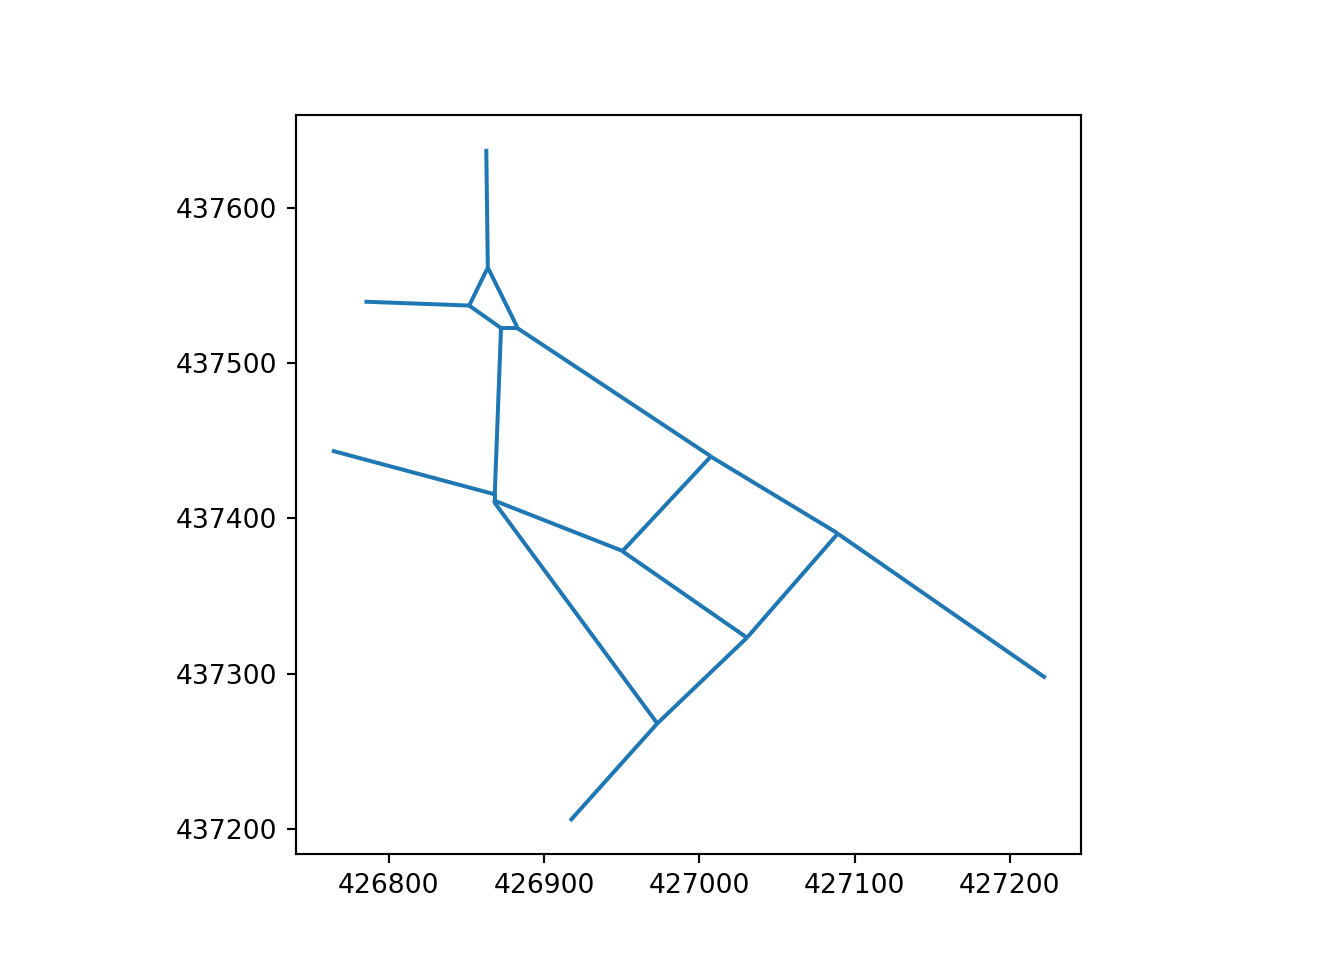
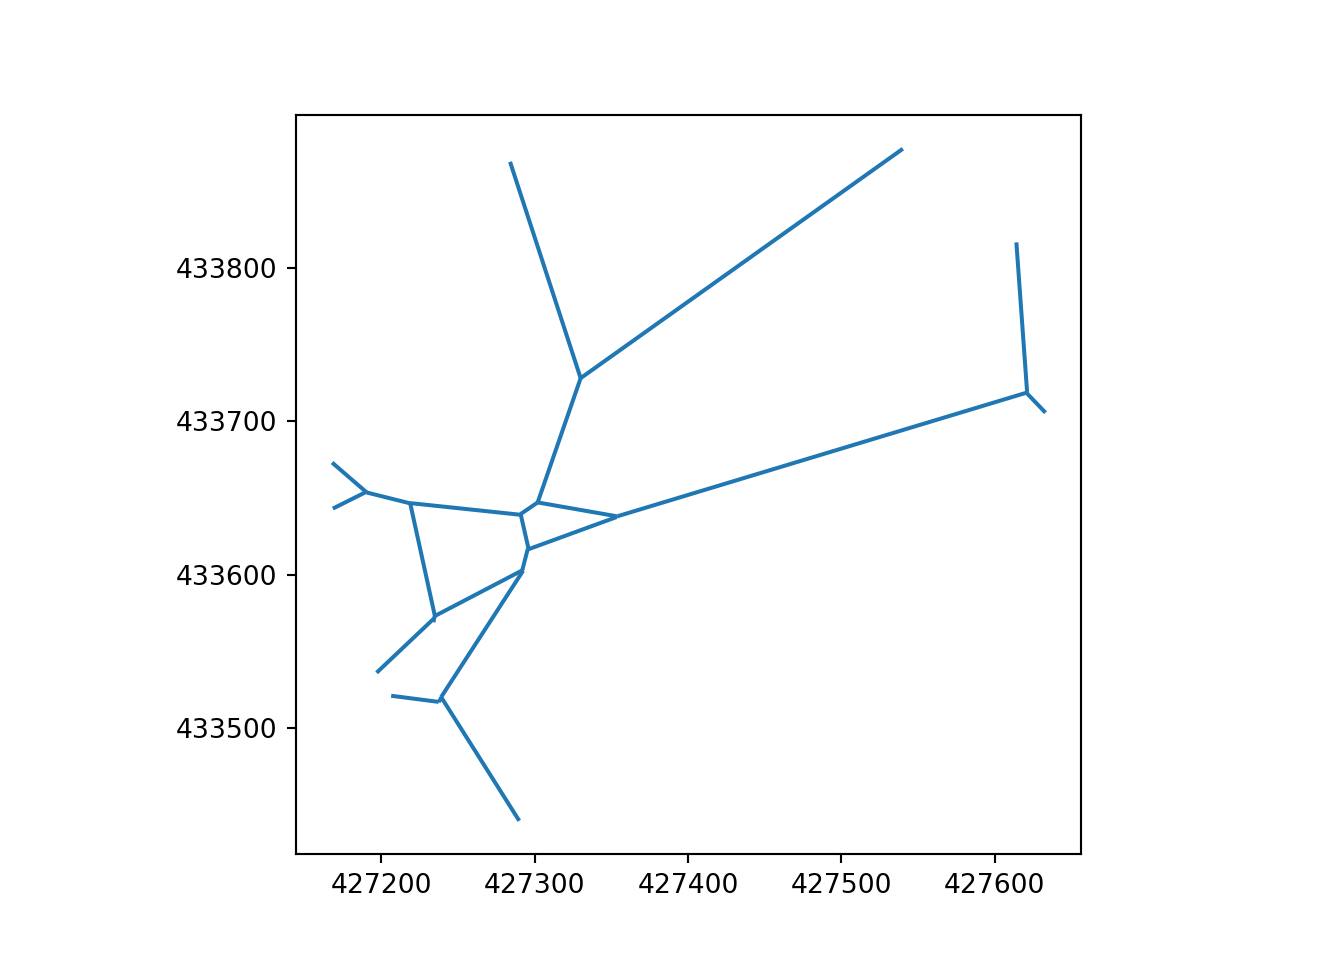
Figure 16 illustrates the primal network derived from the Voronoi approach.
5 Joining route networks
After generating a simplified network using the methods described in the previous sections or through an alternative approach, the next crucial step involves transferring attribute values from the detailed network to the simplified one. This process is commonly referred to as ‘conflation’ and ‘integration’. Conflation is essential because while the source file (detailed network) might be rich in attributes like street names, address ranges, and zip codes, it may lack positional accuracy. Conversely, the target file (simplified network) is likely to be positionally precise but deficient in detailed attributes. As noted by (Sutton 1998), network data integration encompasses two key aspects: the geometric integration, involving the link and node feature elements, and the integration of attributes such as highway data. In our context, the purpose of the joining stage is to merge the detailed attributes from the source network onto the geometrically simplified target network. This ‘joining’ step is vital for using simplified networks as the basis for presenting model outputs generated on a complex network in a easy-to-interpret form.
The process is analogous to joining two datasets based on a common ‘key’ variable. In this case there is no definitive key, meaning that network joining can be regarded as a ‘fuzzy’ or ‘keyless’ join process (Suri et al. 2021; Wachowicz and Mrozek 2019): as with the network simplification steps outlined above, the user must select joining parameters to maximise the accuracy of the join. The simplified (typically denoted ‘x’) object can also be referred to as the ‘target’ object, following the terminology used to describe database and ‘spatial similarity’ joins (Ballesteros, Cary, and Rishe 2011). There are at least a couple of implementations of network joining approaches in open source software: the rnet_merge() function in the stplanr R package (Lovelace, Ellison, and Morgan 2019), and the rnetmatch Rust crate which has binding to R and (soon) Python. The details of network joining methods, algorithms and implementations are outside the scope of this paper, see the documentation associated with the projects mentioned above for more information.