options(timeout = 3000)
library(osmactive)
library(tidyverse)
library(sf)
library(dplyr)
library(mapview)
tmap::tmap_mode("view")
The default classification is the Cycling by Design guidance from the Scottish Government. The following code shows how we implemented it.
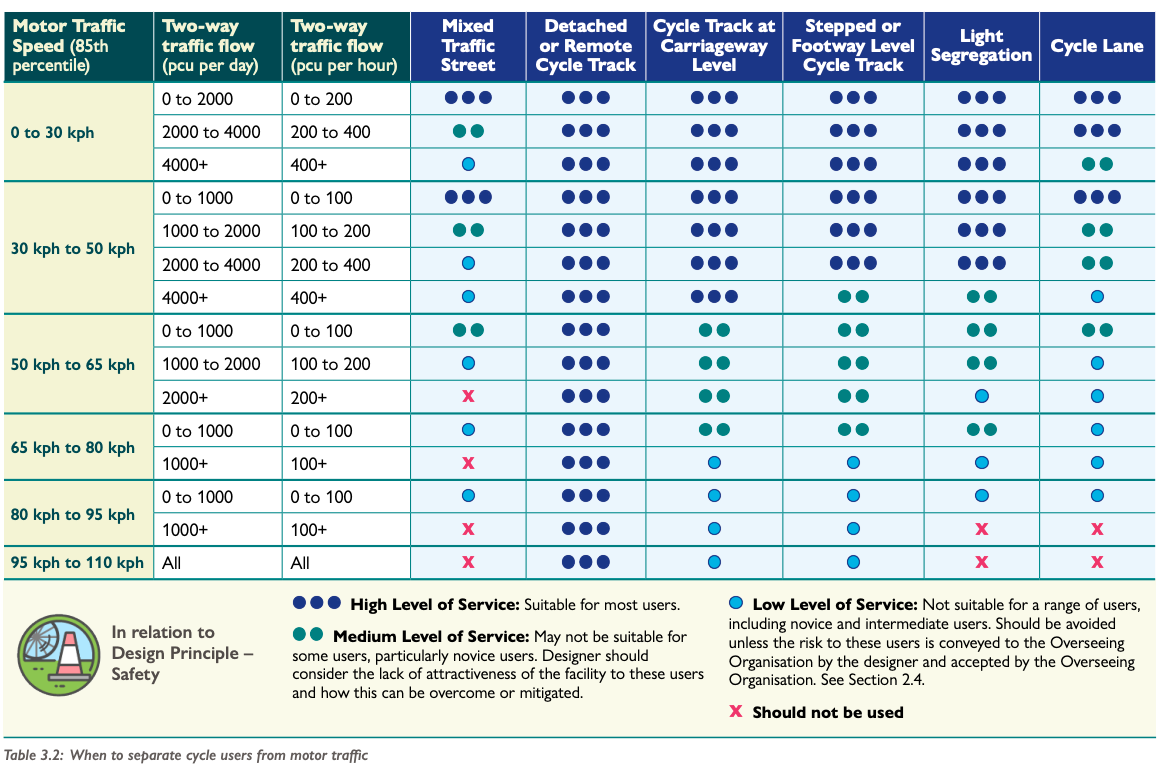
Transport Scotland’s Cycling by Design classification
The level of service associated with each link can be calculated based on the Level of Service table in the Cycling by Design guidance:
Testing the classification
osm_net = osmactive::get_travel_network("Edinburgh") |> st_transform(crs = 27700)
zone = zonebuilder::zb_zone("edinburgh", n_circles = 3) |> st_transform(crs = 27700)
osm_net = osm_net[zone, ]
osm = osmactive::get_cycling_network(osm_net)
cycle_net = get_cycling_network(osm)
drive_net = get_driving_network(osm)
drive_net_major = get_driving_network(osm)
cycle_net = distance_to_road(cycle_net, drive_net)
cycle_net = classify_cycle_infrastructure(cycle_net)
table(cycle_net$detailed_segregation)
table(cycle_net$cycle_segregation)
We can then create the Speed Limit (mph) and
AADT columns in the cycle_net object:
print("Original maxspeed for residential:")
unique((cycle_net |> filter(highway == "residential"))$maxspeed)
print("Original maxspeed for service:")
unique((cycle_net |> filter(highway == "service"))$maxspeed)

cycle_net_speeds = clean_speeds(cycle_net)
unique((cycle_net_speeds |> filter(highway == "residential"))$maxspeed_clean)
unique((cycle_net_speeds |> filter(highway == "service"))$maxspeed_clean)

cycle_net_volumes = estimate_traffic(cycle_net_speeds)
cycle_net$`Speed Limit (mph)` = classify_speeds(cycle_net_speeds$maxspeed_clean)
cycle_net$AADT = npt_to_cbd_aadt_numeric(cycle_net_volumes$assumed_volume)
table(cycle_net$`Speed Limit (mph)`)
table(cycle_net$AADT)
m = plot_osm_tmap(cycle_net)
m
Let’s try running the code on a larger example, covering Edinburgh:
but let’s solve speed NA problem in cycle_net first:
devtools::load_all() # load minimal exmaple cycle_net_f and drive_net_f
cycle_net = cycle_net_f
drive_net = drive_net_f
mapview::mapview(cycle_net, color = "blue") +
  mapview::mapview(drive_net, color = "red")

cycle_net$maxspeed
# Stplanr function:
stplanr::line_bearing(cycle_net)
# All values between -90 and 90 degrees
stplanr::line_bearing(cycle_net, bidirectional = TRUE)

# TODO: check implementations
find_nearby_speeds = function(cycle_net, drive_net, buffer_dist = 10, angle_threshold = 20) {
  infra_no_maxspeed = cycle_net |>
    filter(is.na(maxspeed))

  infra_no_maxspeed$azimuth_cycle =
      stplanr::line_bearing(infra_no_maxspeed, bidirectional = TRUE)

  # This should be a small datasets so OK to buffer:
  infra_no_maxspeed_buffer = sf::st_buffer(infra_no_maxspeed, dist = buffer_dist)

  roads_with_maxspeed = drive_net |>
    filter(!is.na(maxspeed))

  roads_with_maxspeed$azimuth_road =
    stplanr::line_bearing(roads_with_maxspeed, bidirectional = TRUE)

  roads_with_maxspeed_points = sf::st_point_on_surface(roads_with_maxspeed)
  infra_no_maxspeed_nearby = infra_no_maxspeed_buffer[roads_with_maxspeed_points, ]

  joined_data = sf::st_join(
    infra_no_maxspeed_nearby |>
      dplyr::select(osm_id, azimuth_cycle),
    roads_with_maxspeed_points |>
      dplyr::select(maxspeed, azimuth_road),
    join = sf::st_intersects
  )

  joined_data_clean = joined_data |>
    sf::st_drop_geometry() |>
    mutate(
      angle_diff = abs(azimuth_cycle - azimuth_road),
      maxspeed_numeric = gsub(maxspeed, pattern = " mph", replacement = "") |>
      as.numeric()
    ) |>
    filter(angle_diff < angle_threshold) |>
    group_by(osm_id) |>
    dplyr::summarise(
      maxspeed_new = median(maxspeed_numeric, na.rm = TRUE) |>
        paste0(" mph")
    ) |>
    ungroup()

  cycle_net_joined = left_join(
    cycle_net,
    joined_data_clean |>
      dplyr::select(osm_id, maxspeed_new),
  ) |>
    mutate(
      maxspeed = case_when(
        is.na(maxspeed) ~ maxspeed_new,
        TRUE ~ maxspeed
      )
    ) |>
    select(-maxspeed_new)


  return(cycle_net_joined)
}

cycle_net_f_updated = find_nearby_speeds(cycle_net_f, drive_net_f)

mapview(cycle_net_f_updated, zcol = "maxspeed")


# Number of rows with NA maxspeed, before:
sum(is.na(cycle_net_f$maxspeed))
sum(is.na(cycle_net_f_updated$maxspeed))
# We've reduced the number of NAs from 28 to 20 in the test dataset
# testing new get_parallel_values() function
devtools::load_all()
target_net = cycle_net_f
source_net = drive_net_f
cycle_net_f_updated2 = get_parallel_values(
  cycle_net,
  drive_net,
  buffer_dist = 10,
  angle_threshold = 20
)

# Check the number of NAs after imputation
sum(is.na(cycle_net_f_updated2$maxspeed))
# Check the number of NAs before imputation
sum(is.na(cycle_net_f$maxspeed))
osm = get_travel_network("Edinburgh")
cycle_net = get_cycling_network(osm)
drive_net = get_driving_network(osm)

joined_data = find_nearby_speeds(cycle_net, drive_net)
cycle_net = update_missing_speeds(cycle_net, joined_data)

mapview(cycle_net[central_edinburgh, ], zcol = "maxspeed")

cycle_net = distance_to_road(cycle_net, drive_net)
cycle_net = classify_cycle_infrastructure(cycle_net)
mapview::mapview(cycle_net |>select(geometry, cycle_segregation), zcol = "cycle_segregation")
central_edinburgh = osm_edinburgh |>
  sf::st_union() |>
  sf::st_centroid() |>
  sf::st_buffer(3000)
m = plot_osm_tmap(cycle_net[central_edinburgh, ])
m
We can pick out specific bits of infrastructure, e.g. those mentioned in issue #67:
https://www.openstreetmap.org/way/1137759929 shows up as this right now, but this looks like a narrow segregated / stepped track to me. https://www.openstreetmap.org/way/1209807768 is another case that doesn’t seem like off-road.
My idea of off-road cycleway were things like https://www.openstreetmap.org/way/7973833 and https://www.openstreetmap.org/way/265320503 – things with no parallel road nearby.
Let’s pull out those bits of infrastructure:
cycle_net_included = cycle_net |>
  subset(osm_id %in% c(1137759929, 1209807768, 7973833, 265320503))
names(cycle_net_included)
cycle_net_included[c("osm_id", "distance_to_road", "cycle_segregation")] |>
  sf::st_drop_geometry() |>
  knitr::kable()
We can also plot these as follows:
m = plot_osm_tmap(cycle_net_included)
m
Tests for Leith Walk
drive_net_speeds = clean_speeds(drive_net)
# Check for Leith Walk
drive_net_speeds |>
  filter(name == "Leith Walk") |>
  select(matches("speed"))
# devtools::load_all()
cycle_net_los = level_of_service(cycle_net)
# |>
# select(osm_id, `Level of Service`, `Speed Limit (mph)`, AADT, cycle_segregation)
table(cycle_net_los$`Level of Service`)
# Count NA values:
cycle_net_los |>
  sf::st_drop_geometry() |>
  group_by(`Speed Limit (mph)`, AADT, cycle_segregation) |>
  summarise(na = sum(is.na(`Level of Service`))) |>
  filter(na > 0) |>
  arrange(desc(na))
cycle_net_los_plot = cycle_net_los |>
  select(osm_id, `Speed Limit (mph)`, AADT, cycle_segregation, `Level of Service`)
mapview::mapview(cycle_net_los, zcol = "Level of Service")